Getting Started Tutorial
This step-by-step tutorial walks you through the complete workflow of setting up Intugle — from creating a workspace to uploading data, generating your Semantic Data Graph, and asking your first question.
This tutorial takes approximately 10-15 minutes to complete.
What You'll Learn
| Step | What You'll Do | Time |
|---|---|---|
| 1 | Create a new workspace | 2 min |
| 2 | Add a data connection | 2 min |
| 3 | Upload sample data | 3 min |
| 4 | Generate the Semantic Data Graph | 5 min |
| 5 | Ask your first question | 2 min |
| 6 | Create a Dashboard | 3 min |
| 7 | Create a Data Product | 3 min |
| 8 | View Deployed Apps | 2 min |
| 9 | Configure ChatApp Settings | 3 min |
Prerequisites
Before starting, make sure you have:
- An Intugle account (sign up at app.intugle.ai)
- A data file to upload (CSV, Excel, JSON, or Parquet) — or use our sample data below
Sample Data
If you don't have your own data, create a file called sample_sales.csv with this content:
product_id,product_name,category,price,quantity_sold,sale_date,region
1,Laptop Pro,Electronics,1299.99,150,2026-01-15,North America
2,Wireless Mouse,Electronics,49.99,500,2026-01-15,Europe
3,Office Chair,Furniture,349.99,200,2026-01-20,North America
4,Standing Desk,Furniture,599.99,75,2026-01-22,Asia Pacific
5,Monitor 27",Electronics,399.99,300,2026-02-01,North America
6,Keyboard Mechanical,Electronics,129.99,400,2026-02-05,Europe
7,Webcam HD,Electronics,89.99,250,2026-02-10,Asia Pacific
8,Desk Lamp,Furniture,59.99,600,2026-02-15,North America
9,USB Hub,Electronics,39.99,800,2026-02-20,Europe
10,Filing Cabinet,Furniture,199.99,100,2026-03-01,Asia Pacific
Step 1: Create a New Workspace
A workspace is an isolated environment that contains all your data connections, sessions, apps, and settings for a specific project or team.
1.1 Open the Workspace Switcher
Click the workspace switcher button at the top of the page. It shows your current workspace name (e.g., "Kritika Agrawal › B2B Technology").
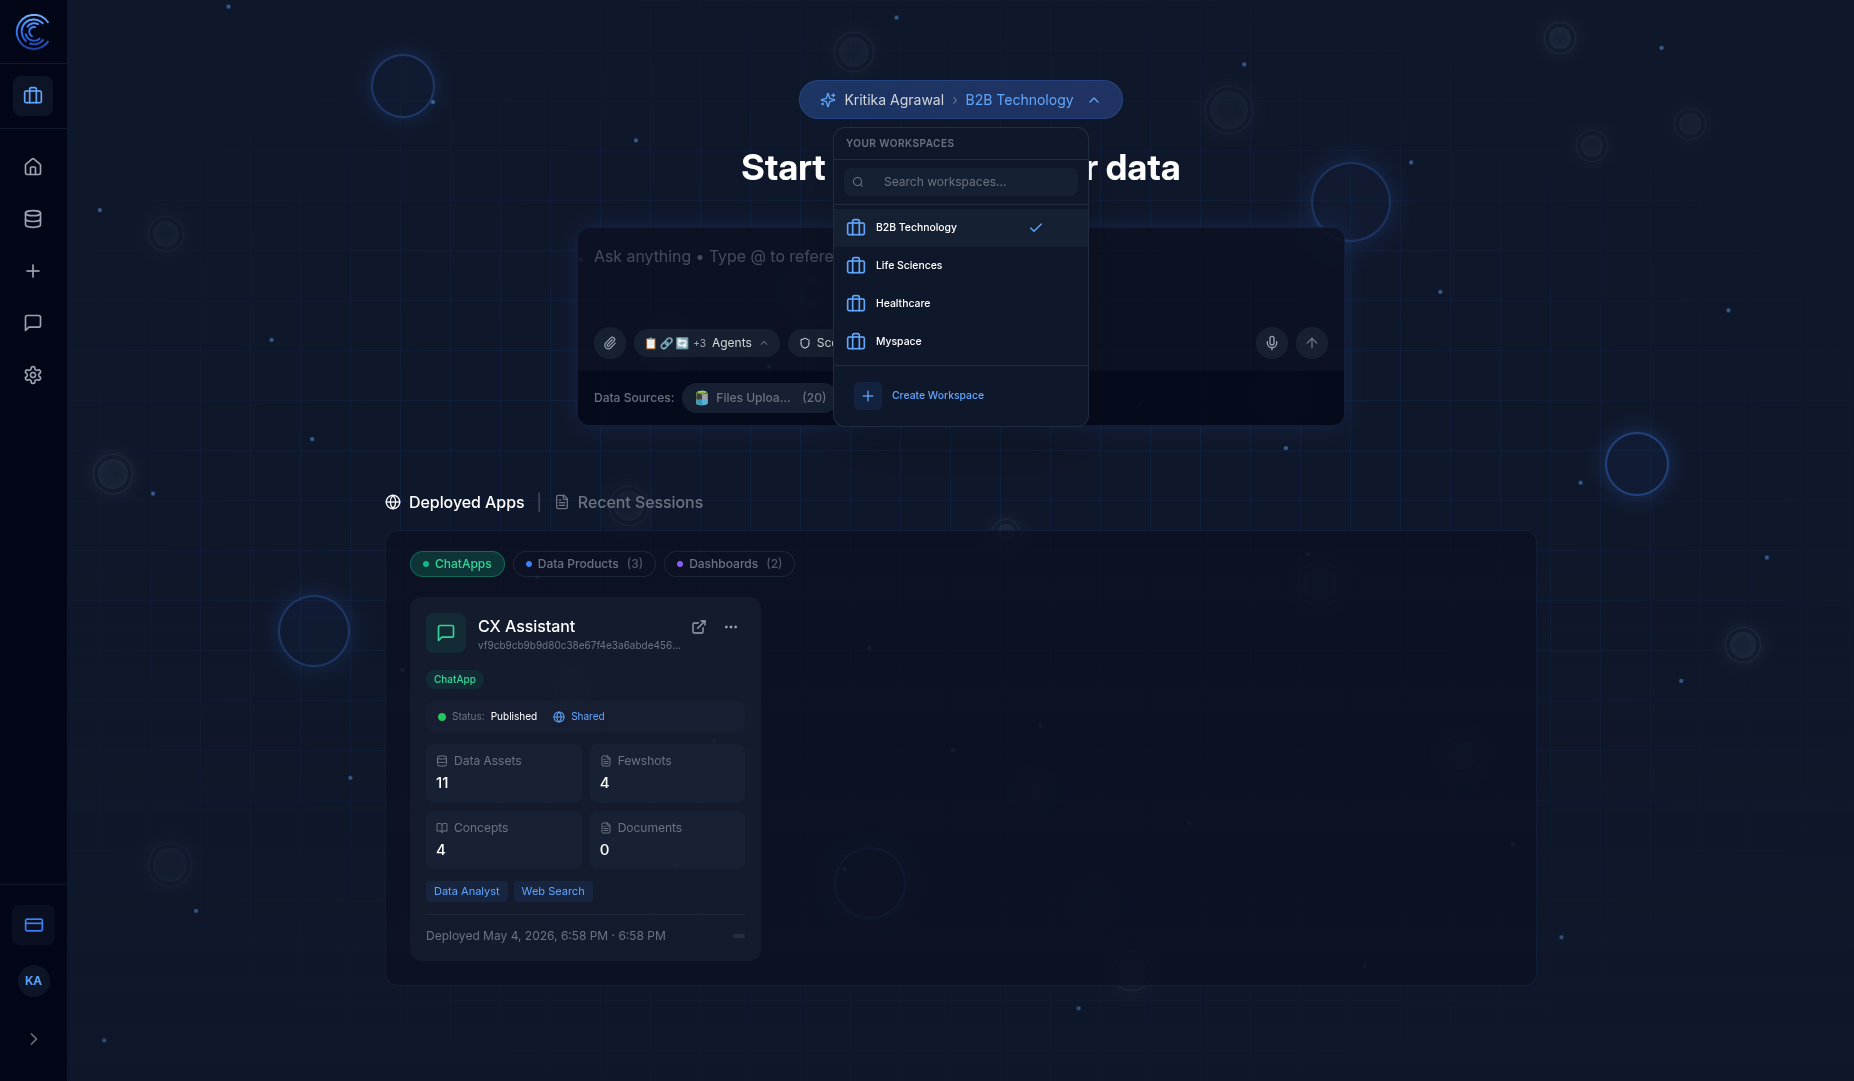
Workspace Switcher Features
| Element | Description |
|---|---|
| Search workspaces... | Filter your workspace list by name |
| Workspace list | All workspaces you have access to |
| ✓ (tick) | Indicates the currently active workspace |
| + Create Workspace | Create a brand new workspace |
1.2 Click "Create Workspace"
Click the + Create Workspace button at the bottom of the dropdown.
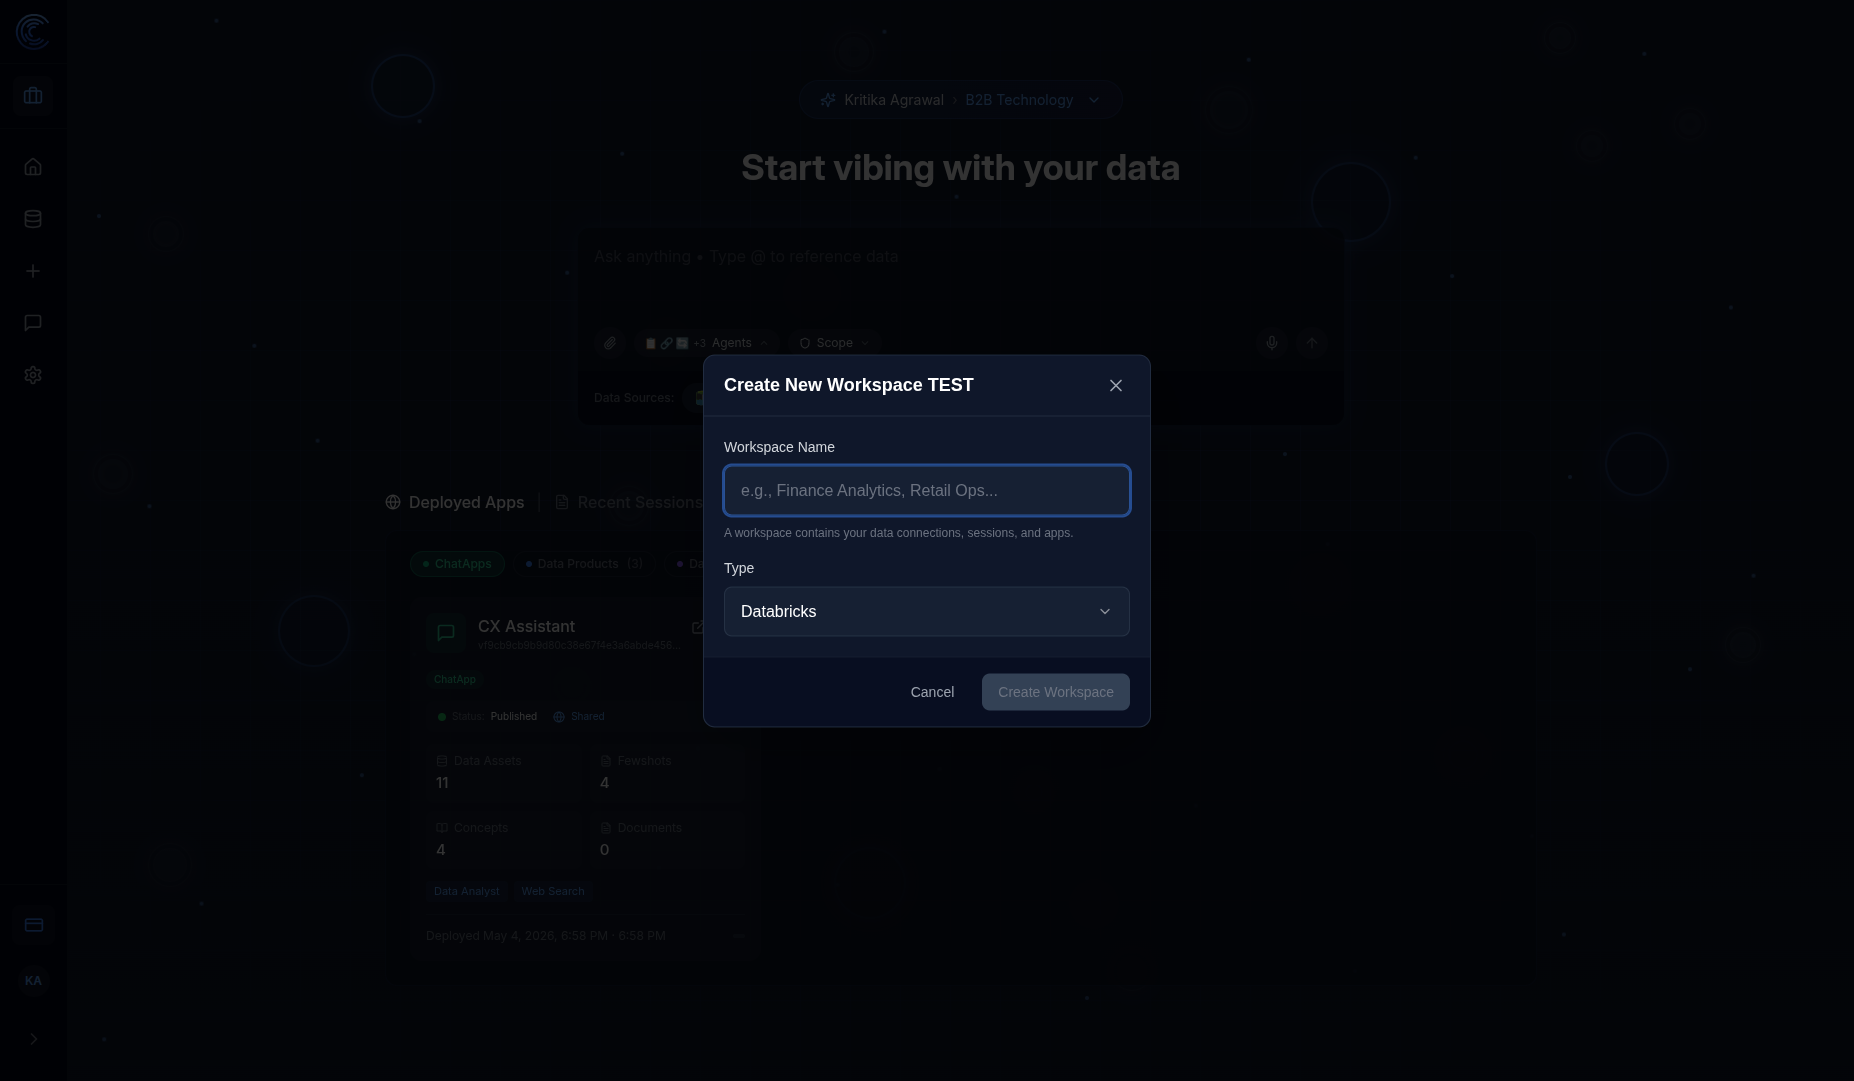
1.3 Enter Workspace Details
| Field | Description | Example |
|---|---|---|
| Workspace Name | A descriptive name for your project | Tutorial Demo |
| Type | The underlying data platform | Databricks (default) |
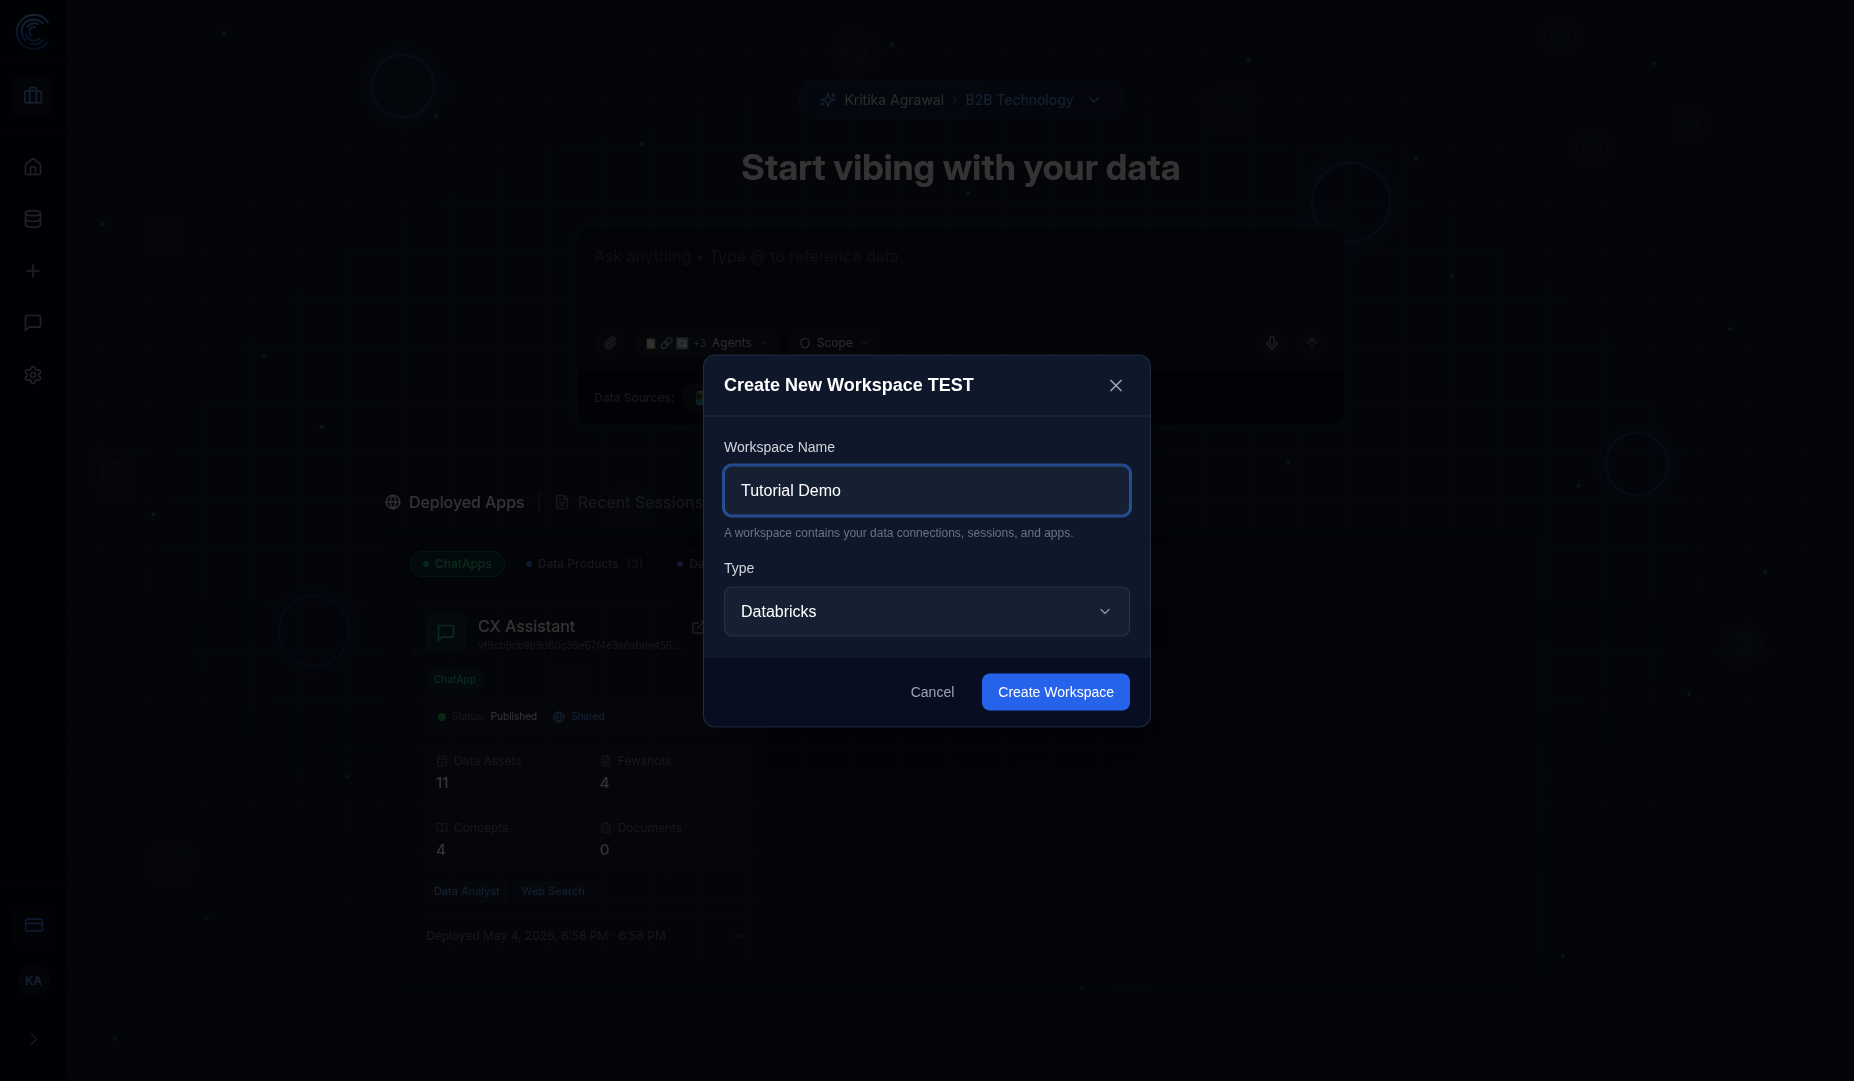
1.4 Click "Create Workspace"
Click the blue Create Workspace button. Intugle will:
- Provision your new workspace
- Set up the underlying infrastructure
- Redirect you to the Data Connections page
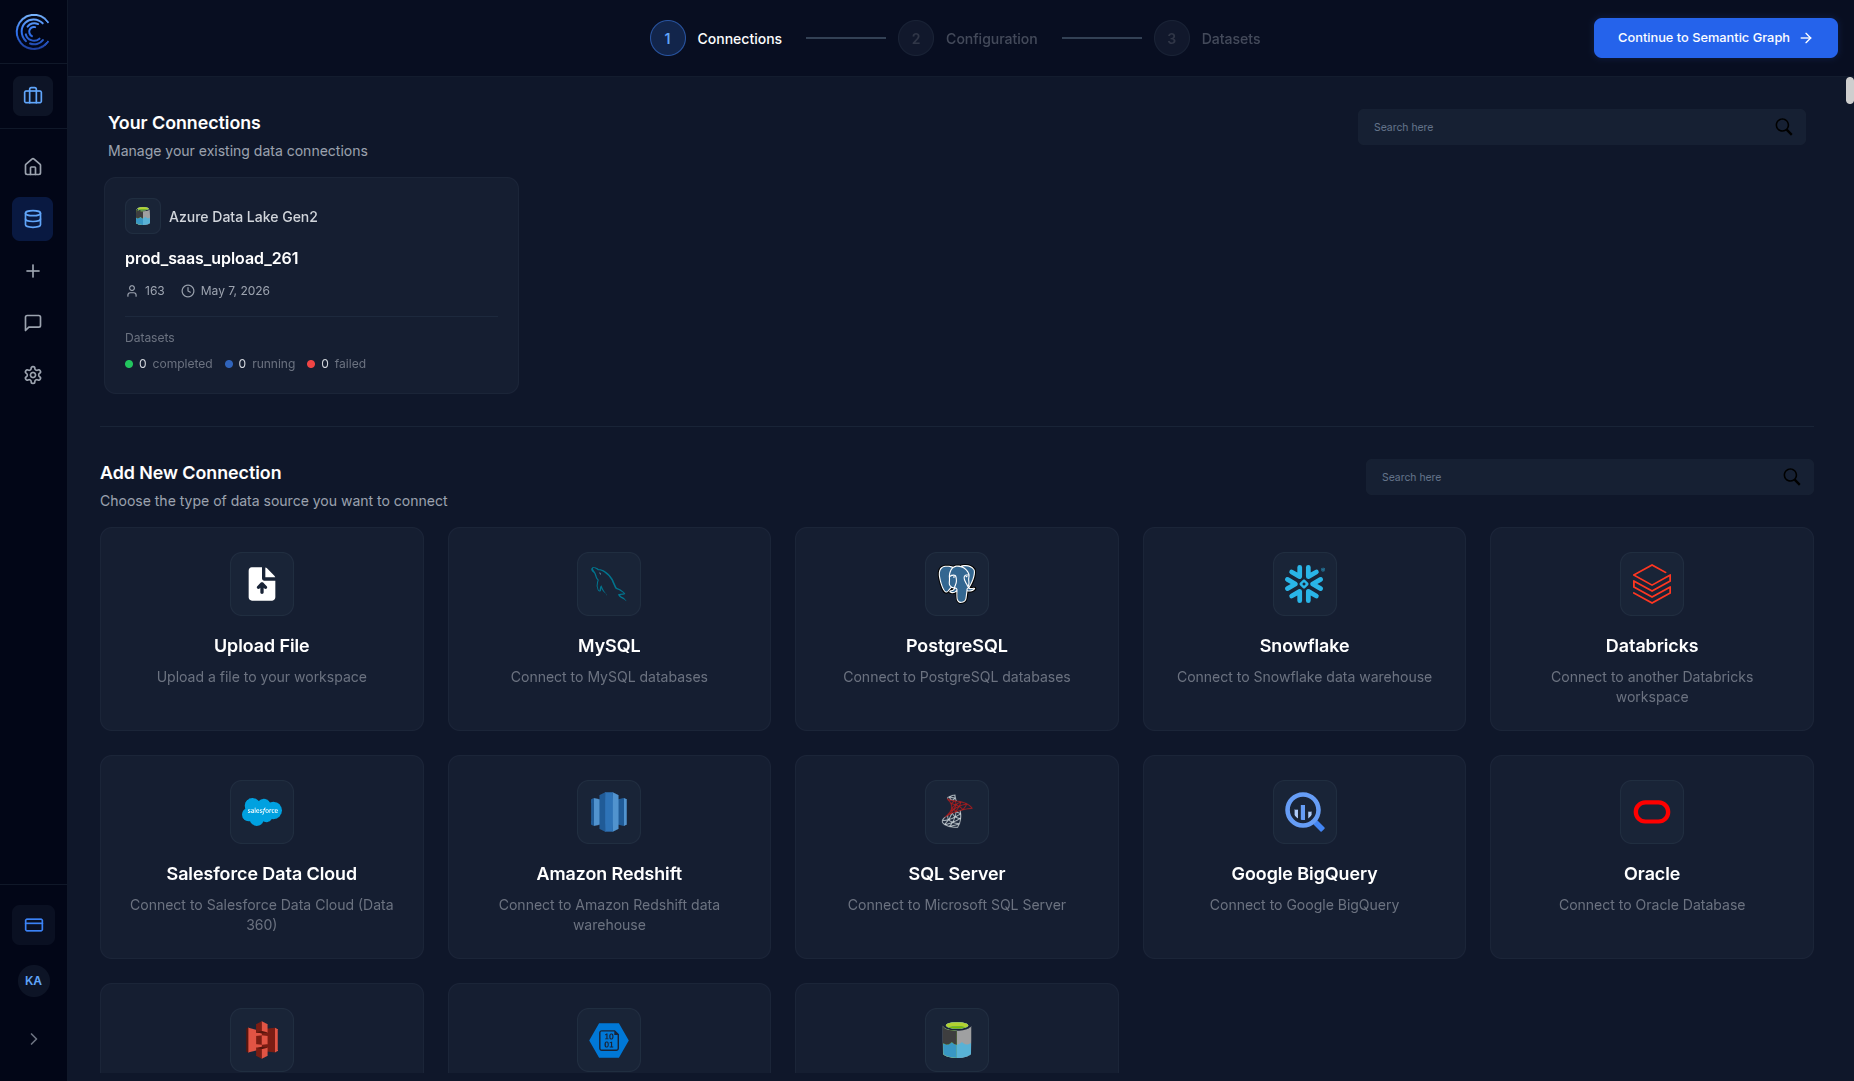
Step 2: Add a Data Connection
After creating your workspace, you're automatically taken to the Data Connections page where you can connect your data sources.
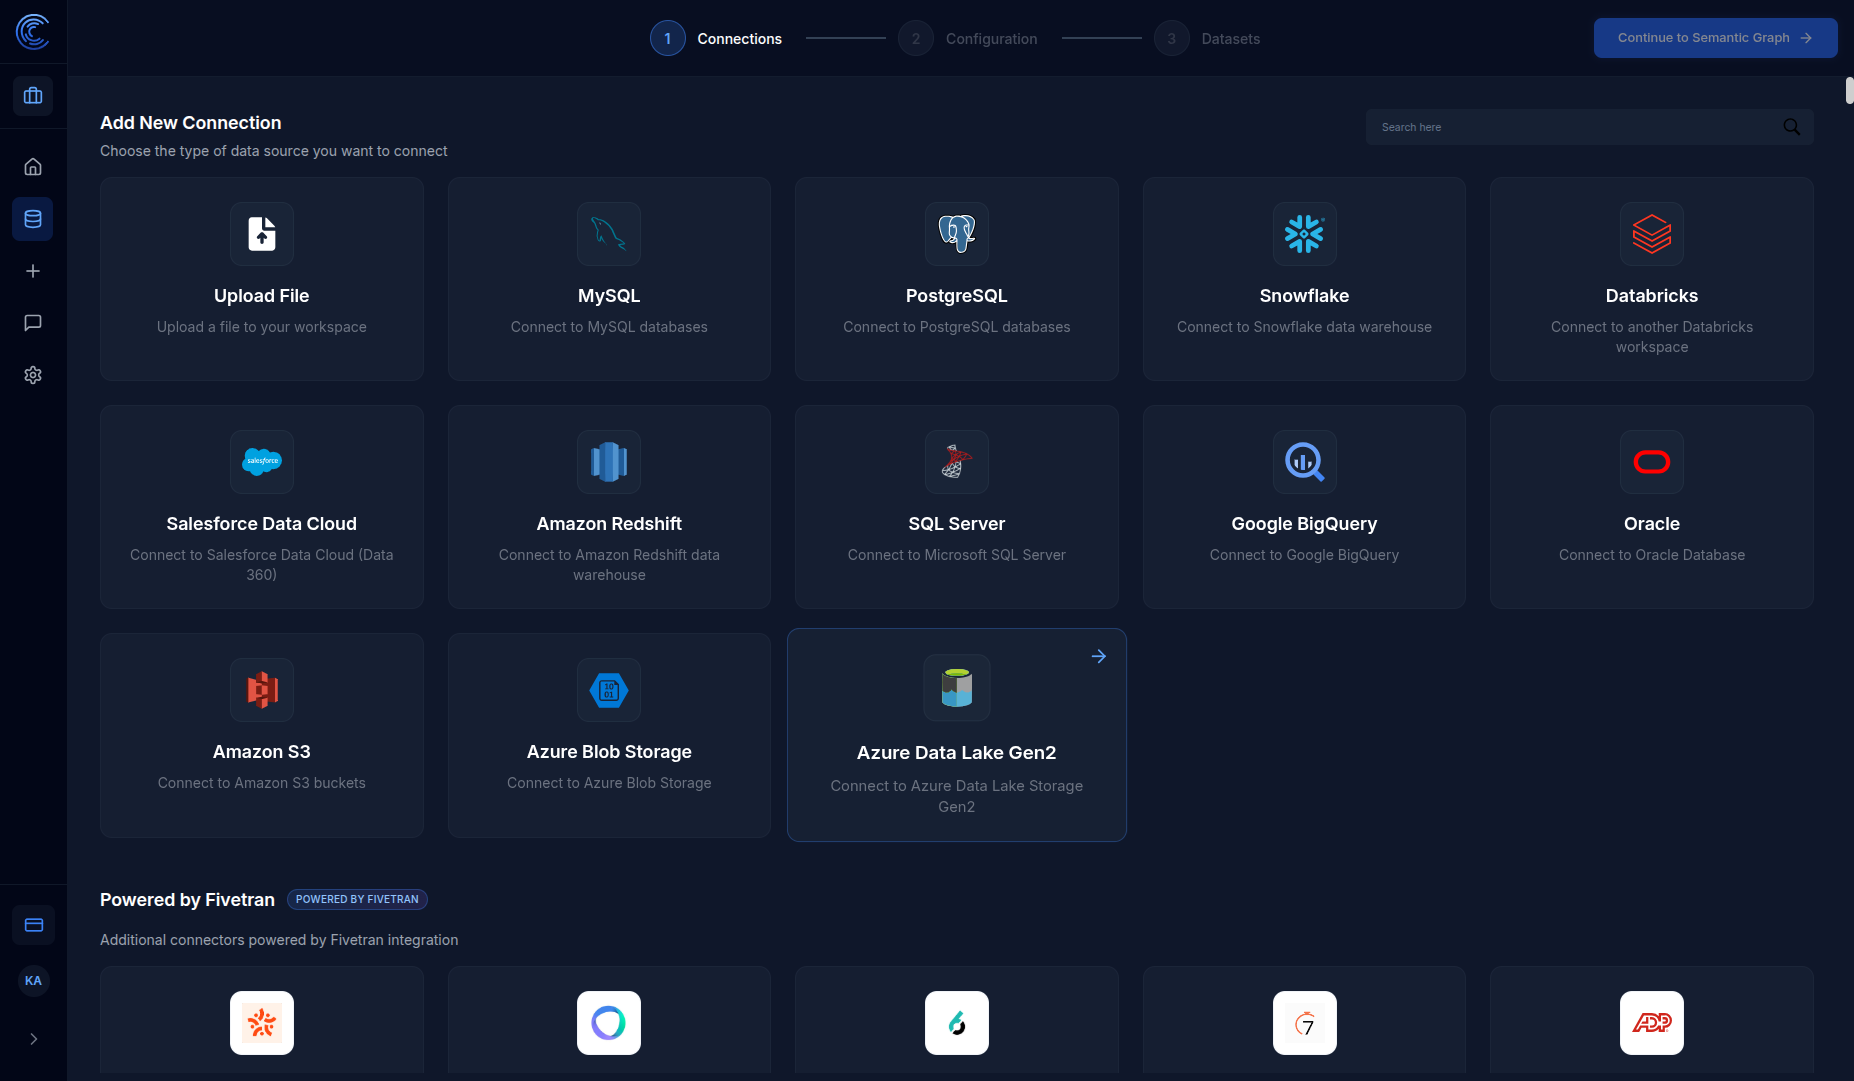
Connection Wizard Steps
The connection wizard has 3 steps:
| Step | Name | What Happens |
|---|---|---|
| 1 | Connections | Choose data source type and provide credentials |
| 2 | Configuration | Select tables and columns to import |
| 3 | Datasets | Review and finalize the imported datasets |
Available Data Sources
| Category | Sources |
|---|---|
| File Upload | CSV, Excel, JSON, Parquet files |
| Databases | MySQL, PostgreSQL, SQL Server, Oracle |
| Data Warehouses | Snowflake, Databricks, Amazon Redshift, Google BigQuery |
| Cloud Storage | Amazon S3, Azure Blob Storage, Azure Data Lake Gen2 |
| SaaS Platforms | Salesforce, and 400+ connectors via Fivetran |
2.1 Click "Upload File"
For this tutorial, click the Upload File tile to upload a CSV file directly.
Step 3: Upload Your Data
The file upload screen lets you upload CSV, Parquet, or JSON files directly to your workspace.
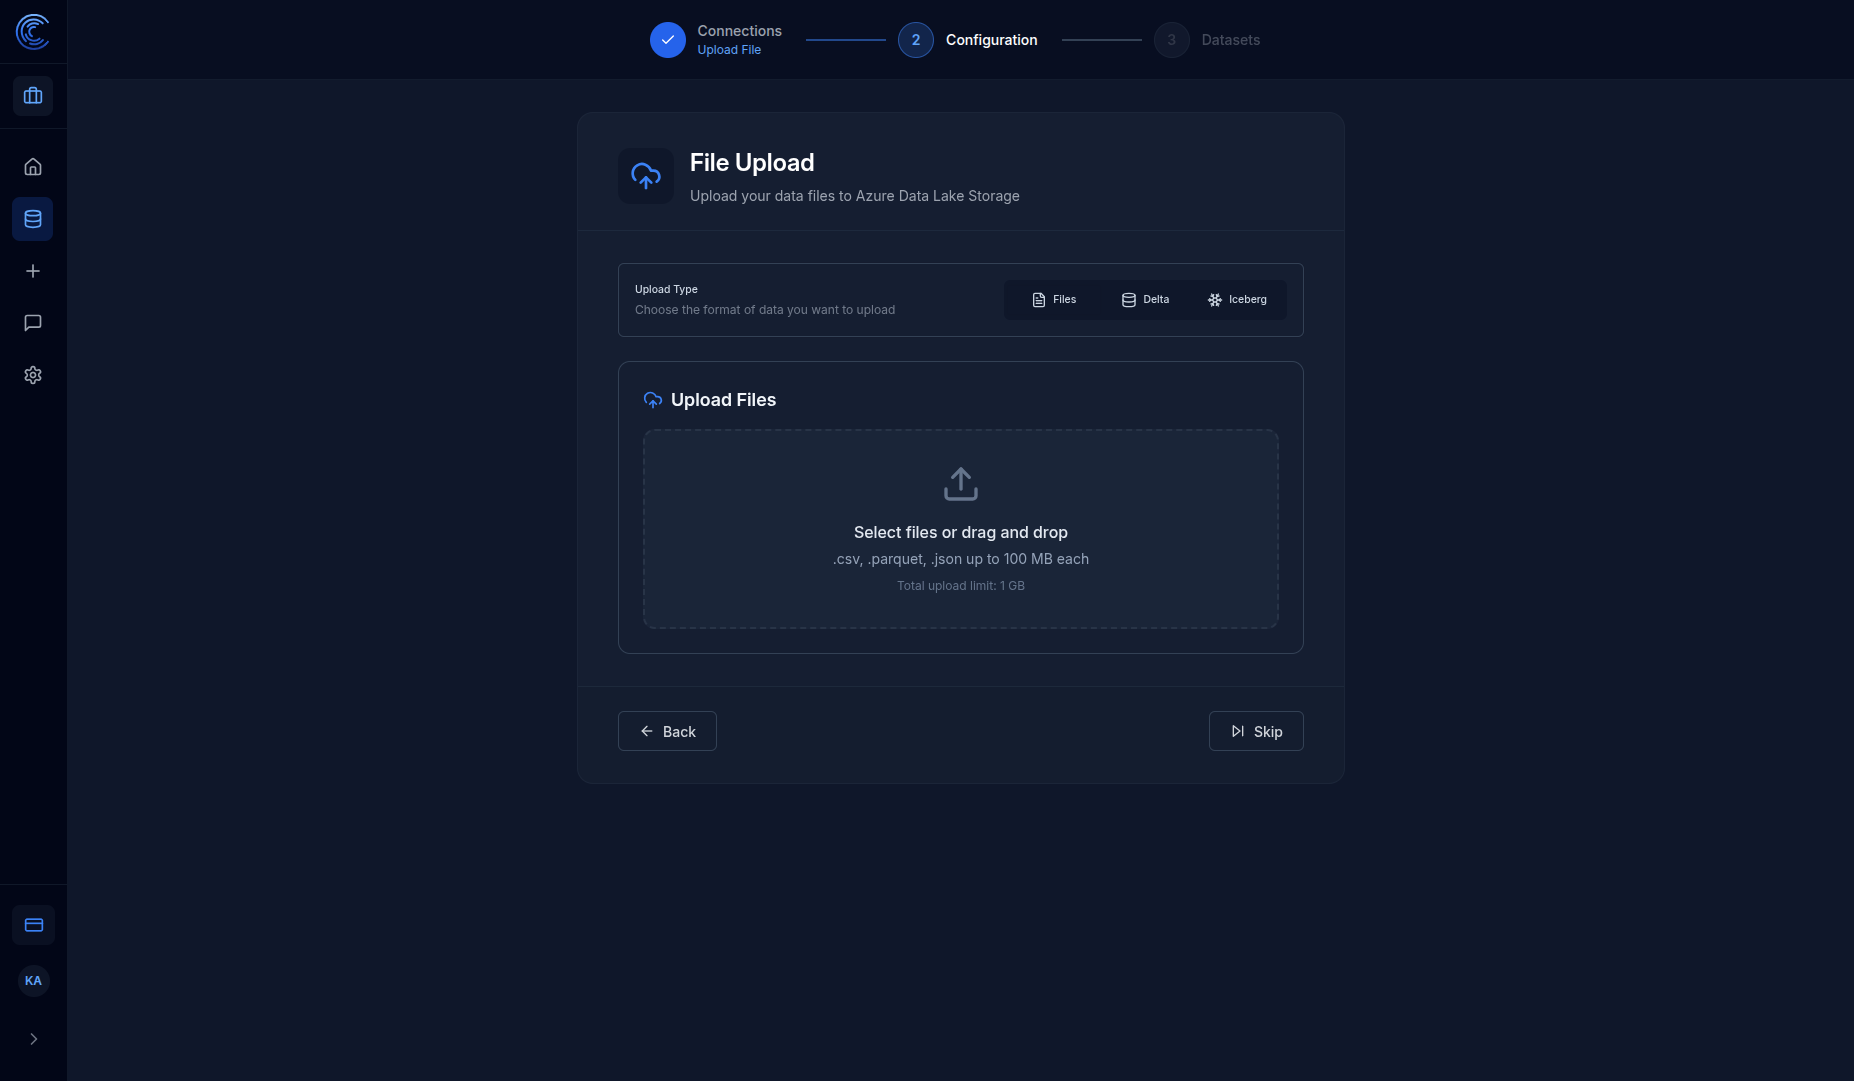
Upload Options
| Tab | Description |
|---|---|
| Files | Upload standard files (CSV, Parquet, JSON) |
| Delta | Upload Delta Lake format tables |
| Iceberg | Upload Apache Iceberg format tables |
File Limits
| Limit | Value |
|---|---|
| Max file size | 100 MB per file |
| Total upload limit | 1 GB |
| Supported formats | .csv, .parquet, .json |
3.1 Select Your File
Click the upload area or drag and drop your sample_sales.csv file.
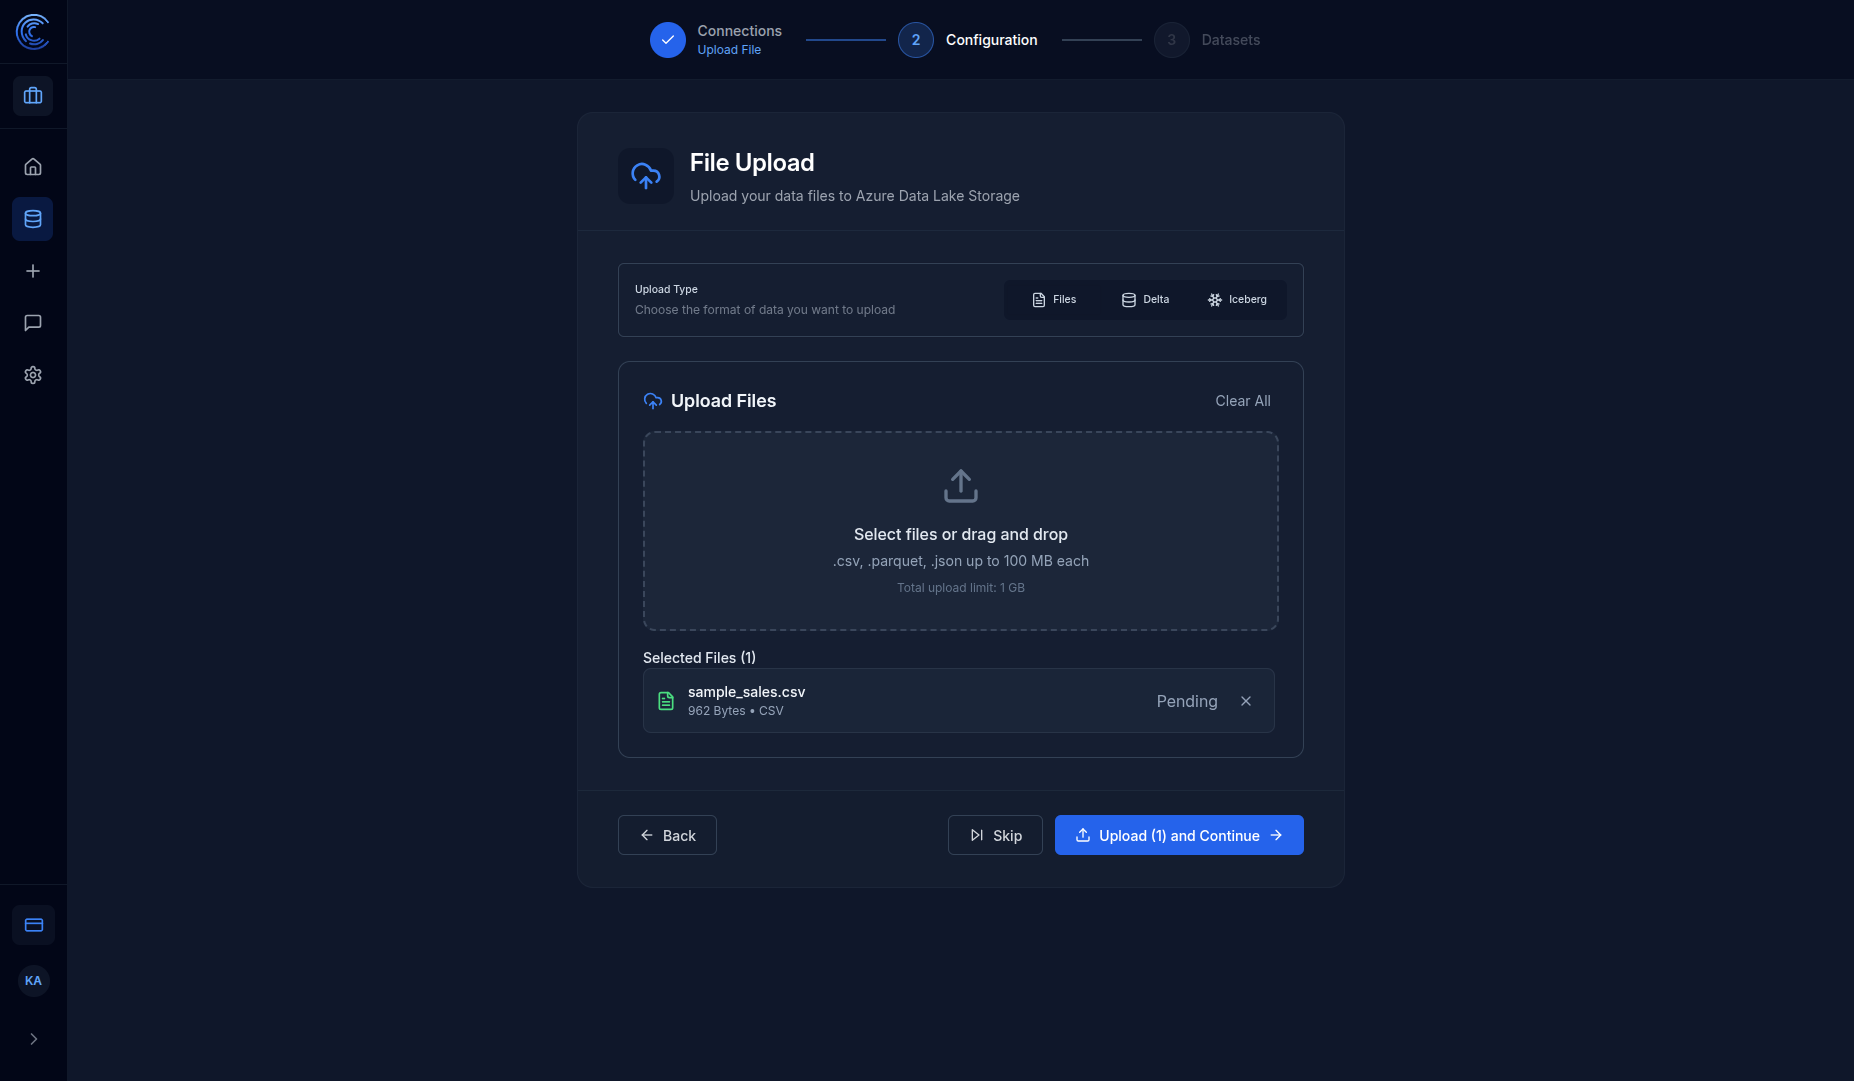
3.2 Click "Upload and Continue"
Click the blue Upload (1) and Continue button to upload your file and proceed to configuration.
Step 4: Configure Your Dataset
After uploading, you'll configure which datasets to include in your semantic graph.
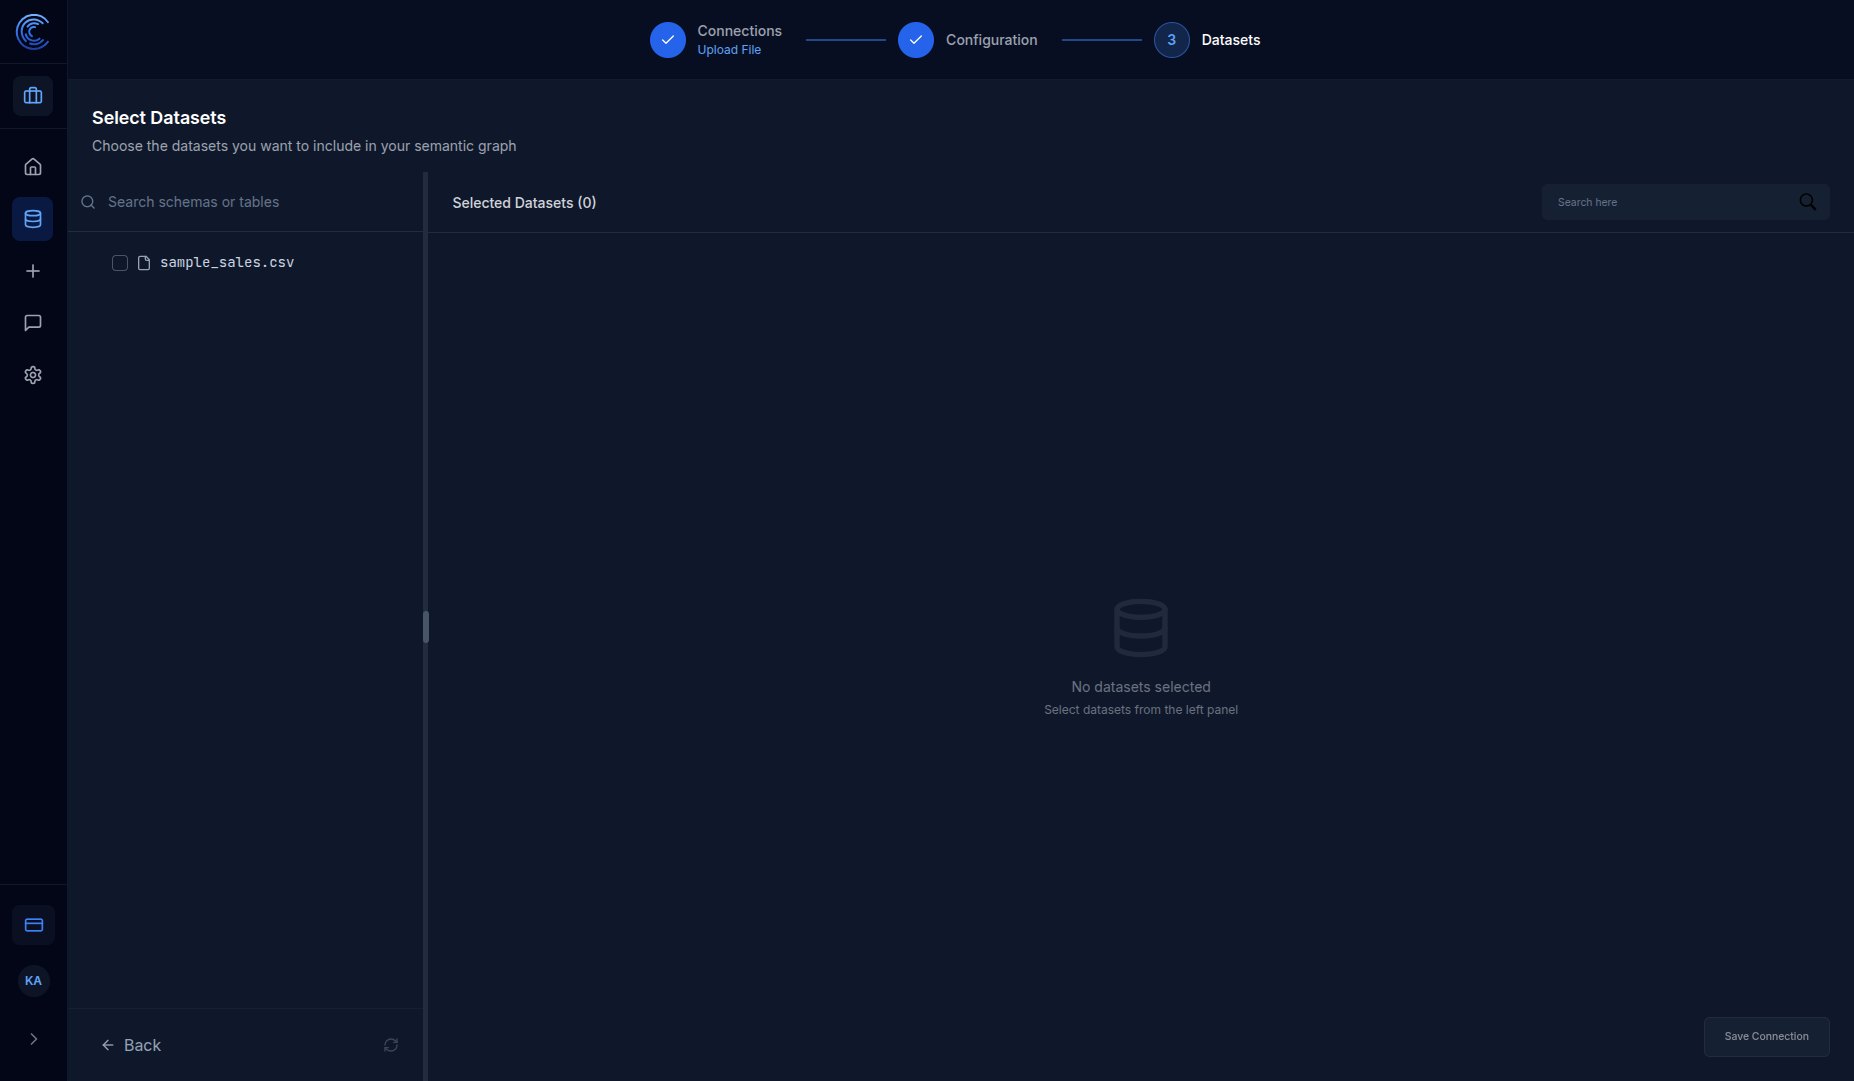
Configuration Features
| Feature | Description |
|---|---|
| Left panel | Shows all available tables/files from your connection |
| Right panel | Shows selected datasets with metadata |
| Search | Filter tables by name |
| Checkbox | Select/deselect tables for inclusion |
4.1 Select Your Dataset
Click the checkbox next to sample_sales.csv to select it.
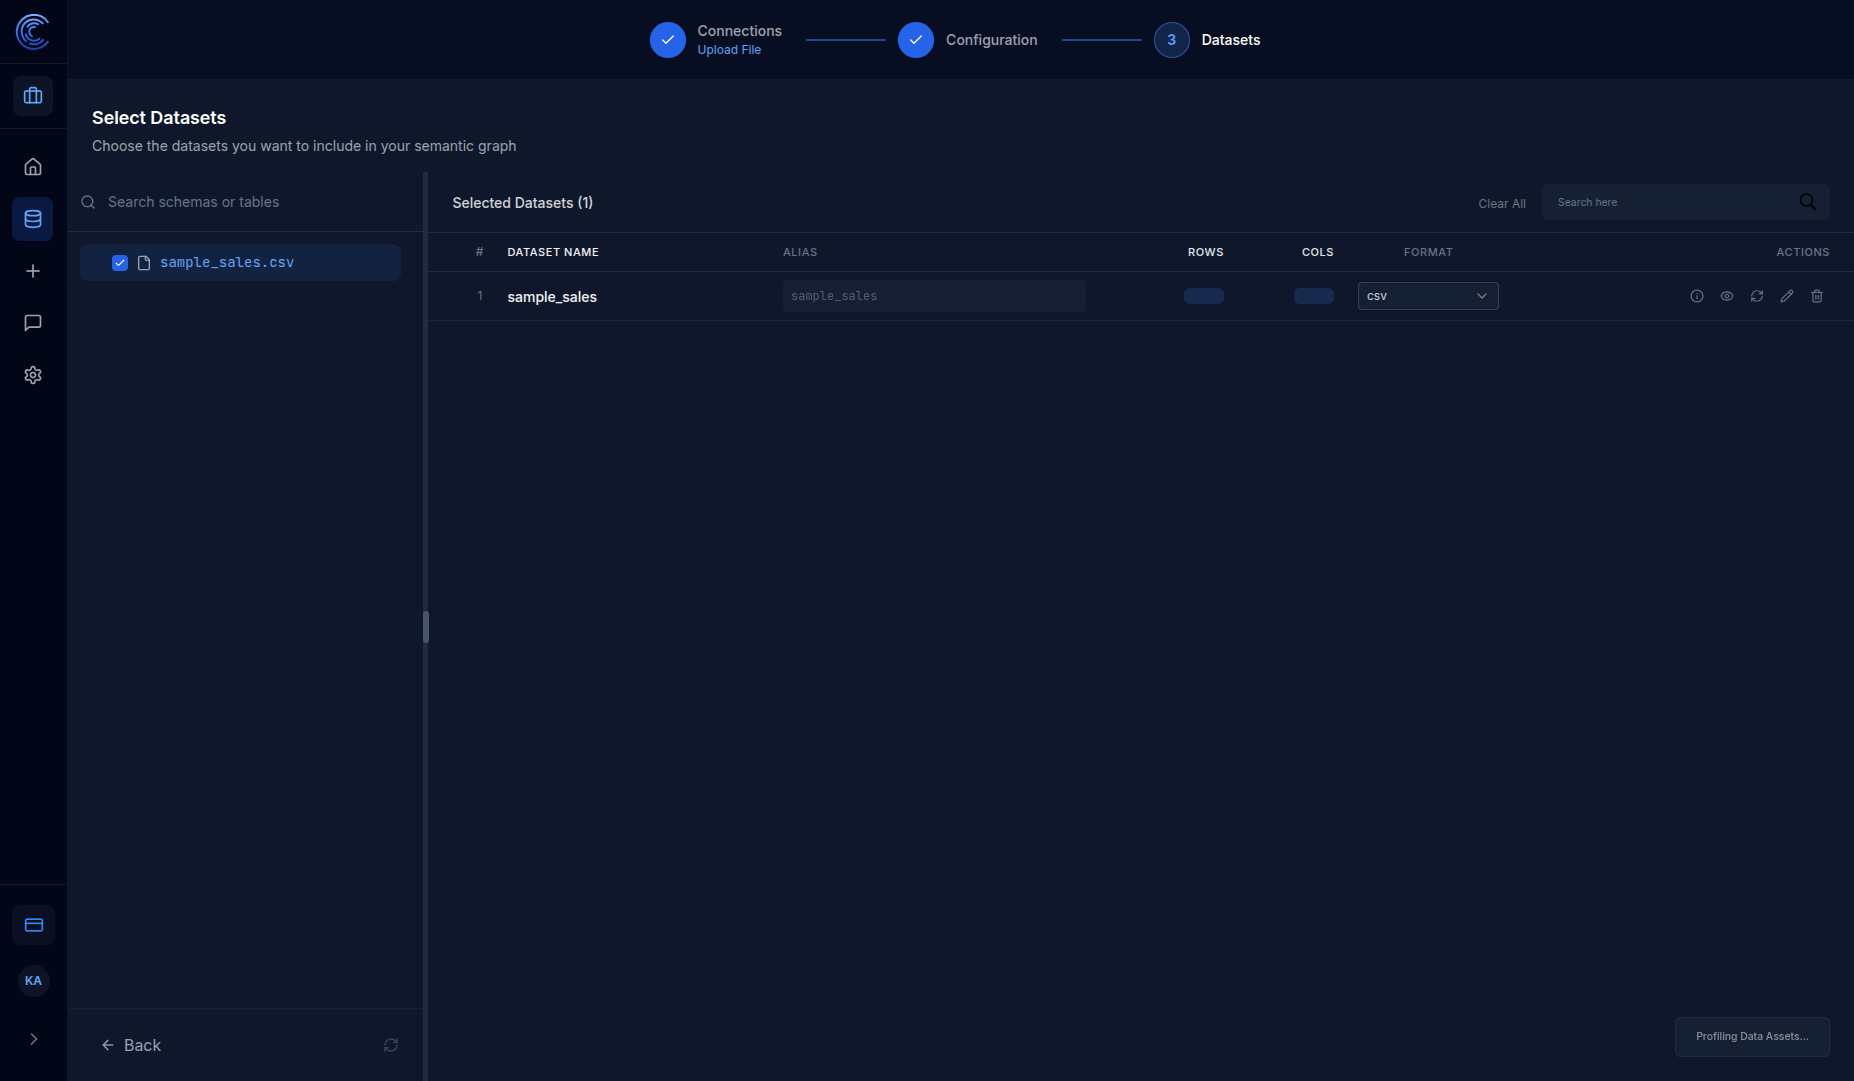
4.2 Wait for Profiling
Intugle automatically profiles your dataset to understand its structure:
| Profiled Information | Description |
|---|---|
| Rows | Total number of records (e.g., 15) |
| Cols | Number of columns (e.g., 7) |
| Data types | Automatically detected column types |
| Statistics | Min, max, unique values, nulls |
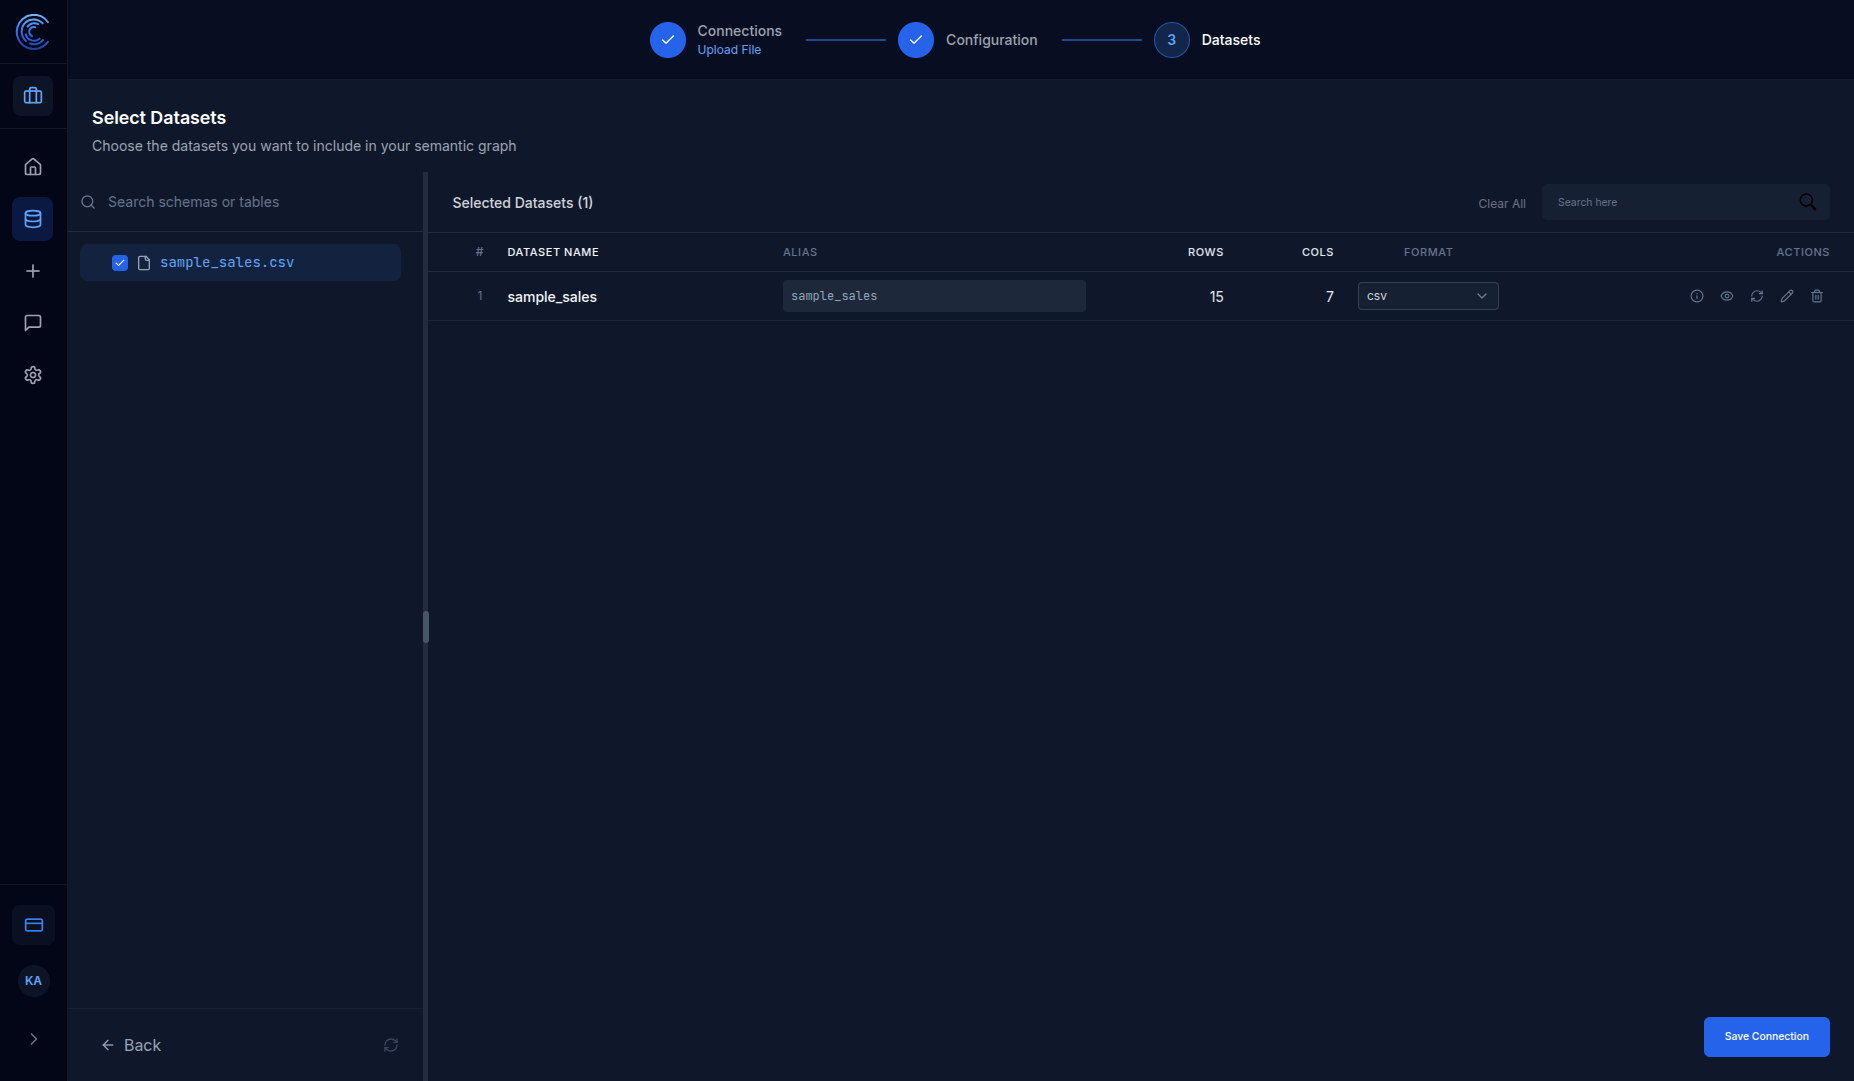
Dataset Actions
| Action | Icon | Description |
|---|---|---|
| Info | ℹ️ | View detailed schema information |
| Preview | 👁️ | Preview sample data rows |
| Refresh | 🔄 | Re-scan the dataset |
| Edit | ✏️ | Modify dataset settings |
| Remove | 🗑️ | Remove from selection |
4.3 Save Connection
Click Save Connection to save your configuration.
Step 5: Generate the Semantic Data Graph
After saving your connection, navigate to the Prompt Flow / Agents page (gear icon in the left sidebar) to generate your Semantic Data Graph.
What is the Semantic Data Graph?
The Semantic Data Graph is a visual map of all your data tables and their relationships. Intugle automatically:
- Analyzes your table schemas
- Identifies relationships between tables (foreign keys)
- Classifies columns as dimensions or measures
- Generates business term definitions for each column
5.1 The Semantic Data Graph Agent
When you open the Agents Service page, you'll see the Semantic Data Graph agent ready to build your graph.
Pipeline Steps
The agent walks you through these steps:
| Step | What Happens | Example Result |
|---|---|---|
| Table Selection | Choose tables to include | 1 table selected |
| Business Context | Set your industry vertical | Retail |
| Data Profiling | Analyze data quality | 100% completeness |
| Business Glossary | Generate term definitions | 7 terms classified |
| Relationship Identification | Find table links | 1 key, 0 links (single table) |
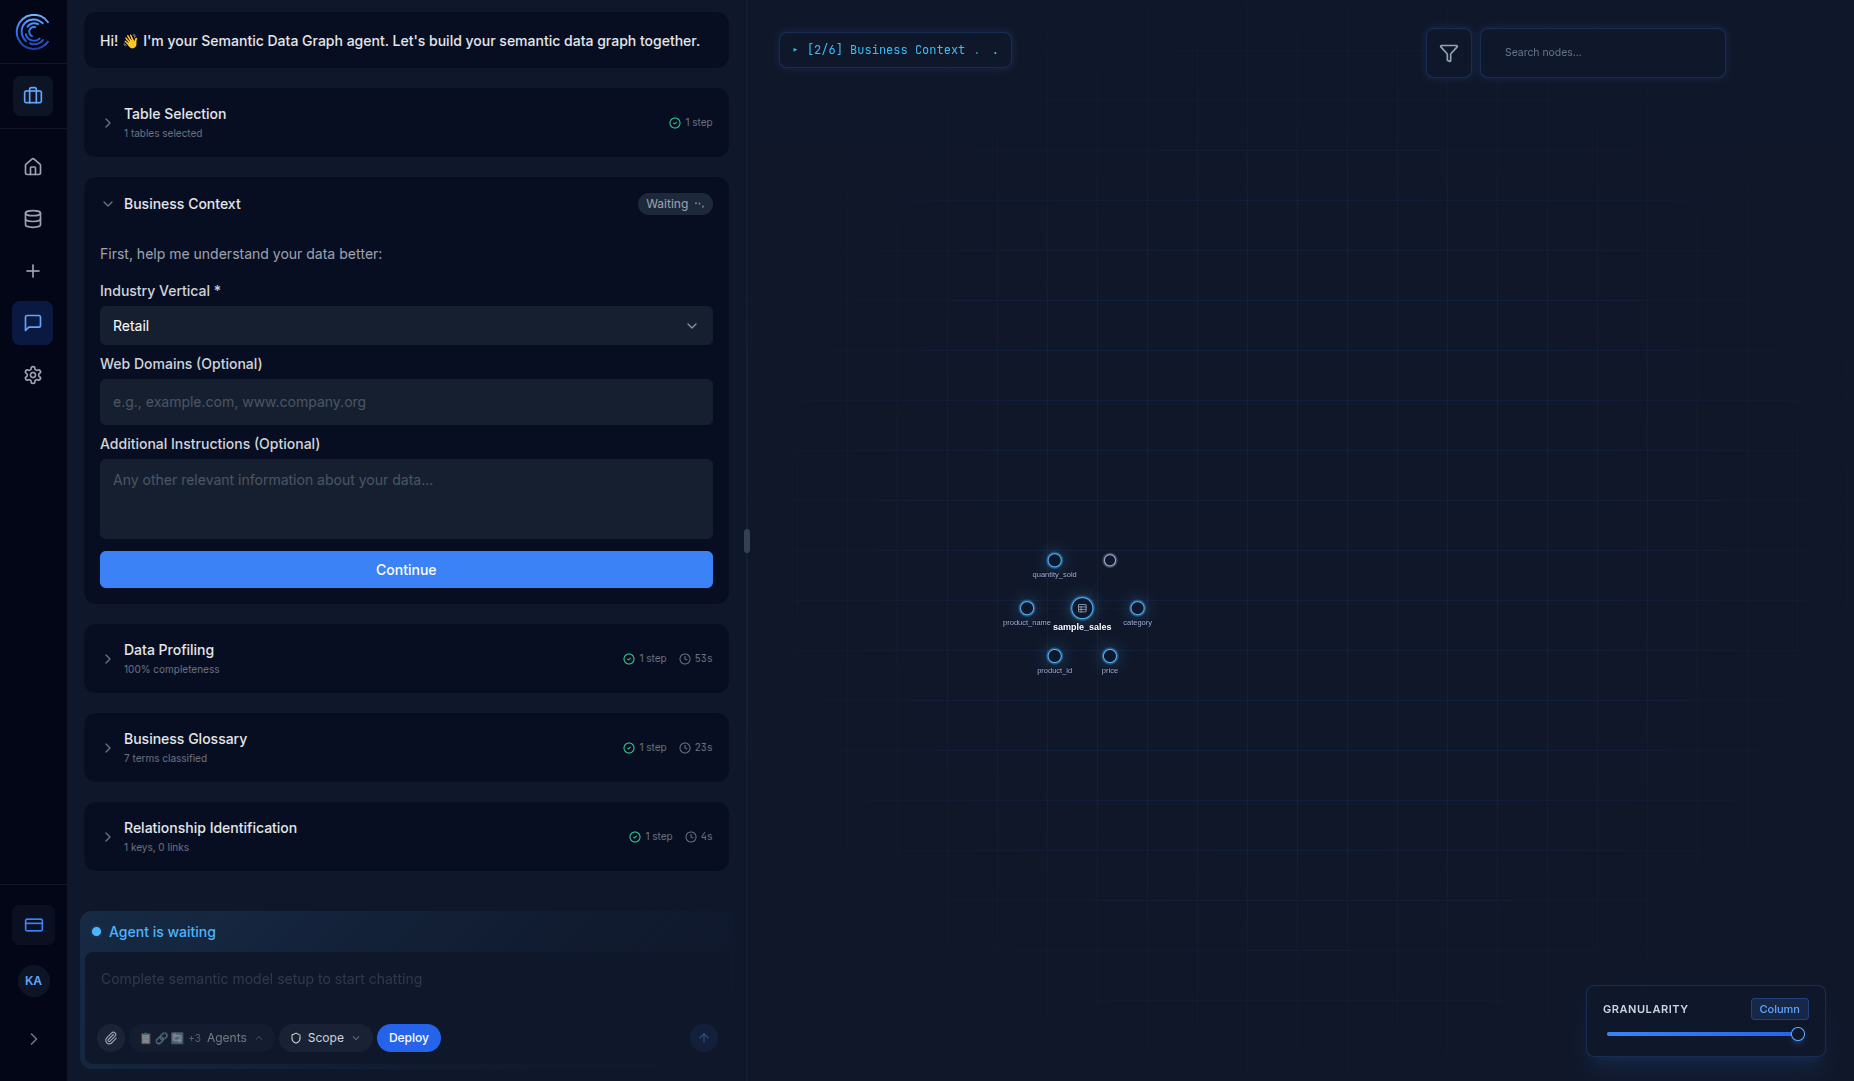
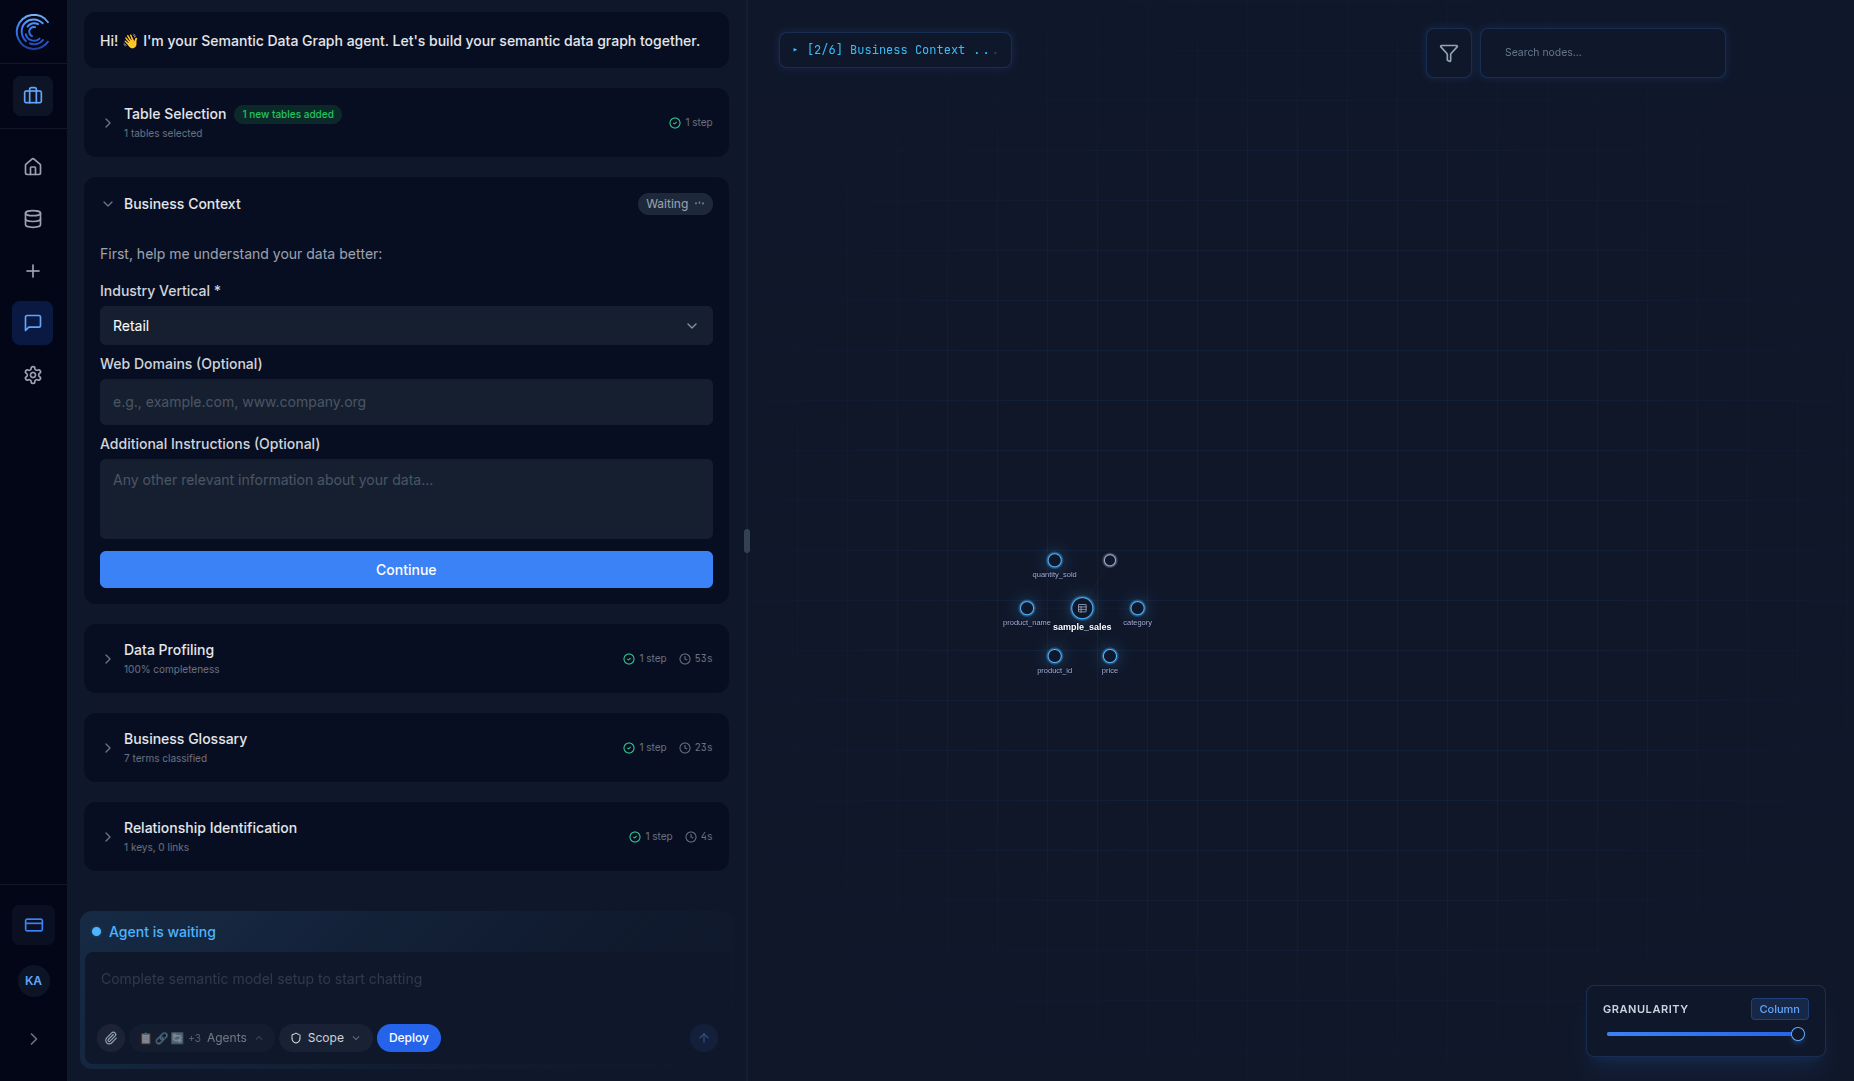
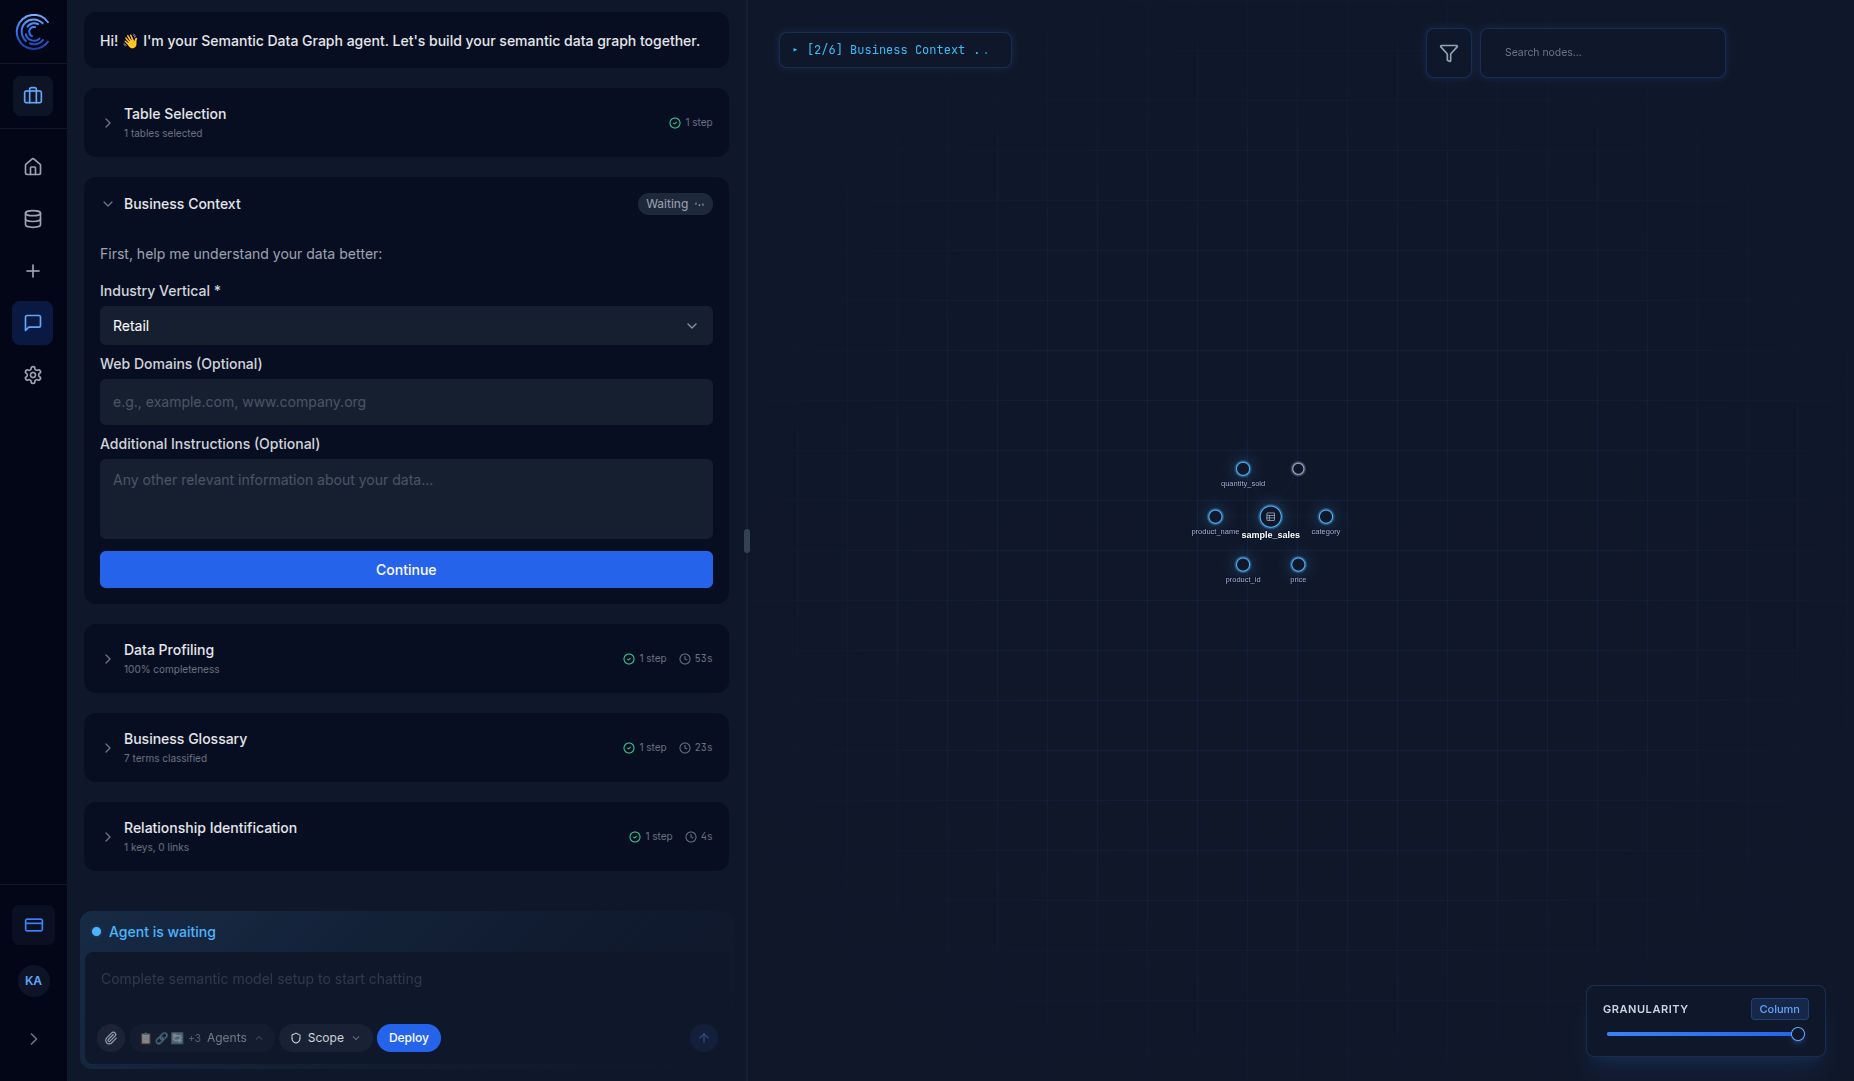
5.2 Configure Business Context
Select your Industry Vertical from the dropdown (e.g., Retail, Healthcare, Finance) to help the AI understand your data context.
5.3 View Data Profiling Results
Once the agent analyzes your data, you'll see detailed profiling results:
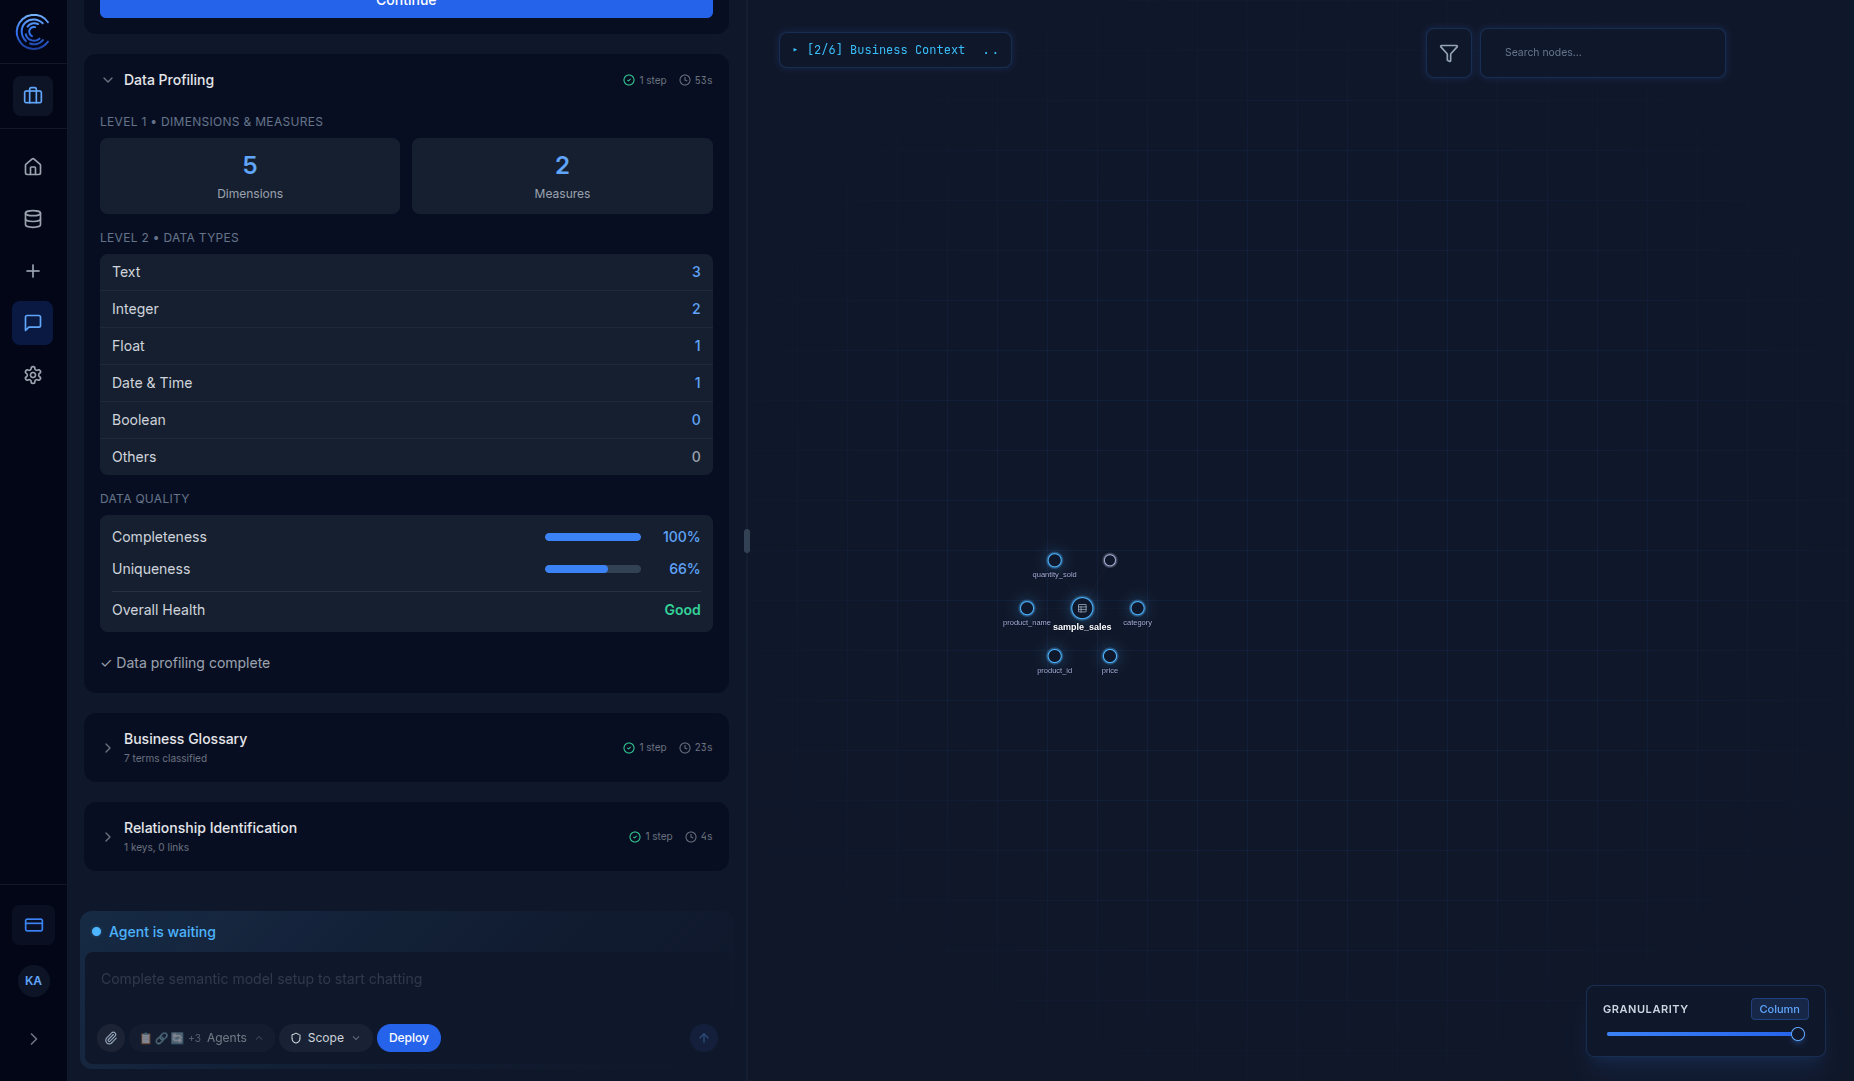
Data Profiling Metrics
| Category | What It Shows |
|---|---|
| Dimensions & Measures | Classification of columns (5 Dimensions, 2 Measures) |
| Data Types | Breakdown by type (Text, Integer, Float, Date & Time, Boolean) |
| Completeness | Percentage of non-null values (100%) |
| Uniqueness | Percentage of unique values (66%) |
| Overall Health | Data quality assessment (Good, Fair, Poor) |
Graph Visualization
On the right side, you'll see the Semantic Data Graph visualization showing your table(s) and their columns:
| Element | Description |
|---|---|
| Center node | Your data table (sample_sales) |
| Connected nodes | Individual columns (product_name, category, price, etc.) |
| Granularity slider | Switch between Table and Column views |
| Search | Find specific nodes in the graph |
For a single-table dataset like our sample, you'll see one central node with column connections. With multiple related tables, you'll see a connected graph showing foreign-key relationships.
Step 6: Ask Your First Question
Once the Semantic Data Graph is generated, you can start asking questions about your data!
Go to the Homepage
Click the Home icon in the left sidebar to return to the homepage.
Ask a Question
In the chat input box, type a question in plain English:
Example questions for our sample sales data:
| Question | What You'll Get |
|---|---|
| "What are the top 5 products by quantity sold?" | A ranked list of best-selling products |
| "Show me total sales by region" | A breakdown of revenue by geographic area |
| "What is the average price by category?" | Average product prices for Electronics vs Furniture |
| "How many products were sold in Q1 2026?" | Total units sold in January-March |
| "Which region has the highest revenue?" | The top-performing region |
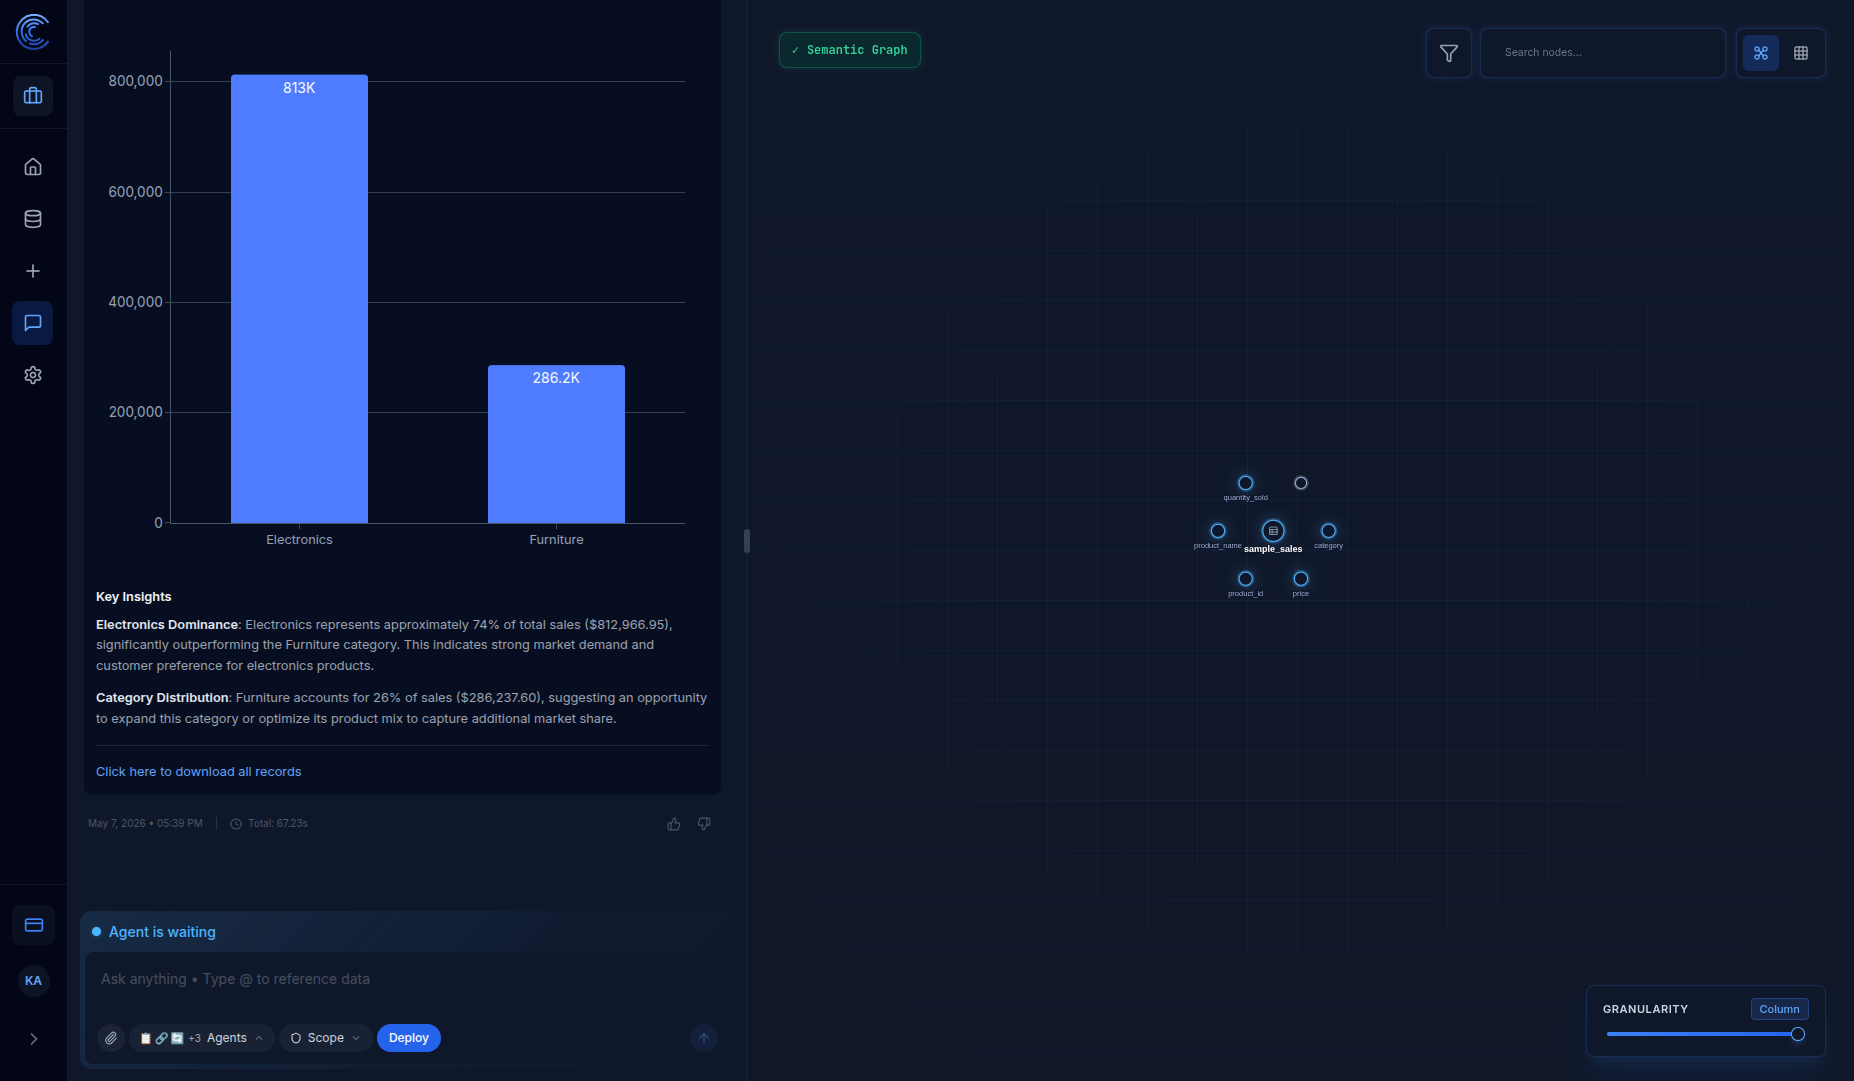
Understanding the Response
Intugle's AI will:
- Parse your question
- Identify relevant tables and columns
- Generate the appropriate SQL query
- Execute the query on your data
- Return results as a table, chart, or summary
Step 7: Create a Dashboard
Dashboards display pinned charts and metrics from your chat sessions. They provide at-a-glance visual analytics.
7.1 Ask a Question That Generates a Chart
First, ask a question that returns visual data. In the chat input, type:
Show me total sales by product category as a bar chart
The AI will generate a chart showing sales breakdown by category.
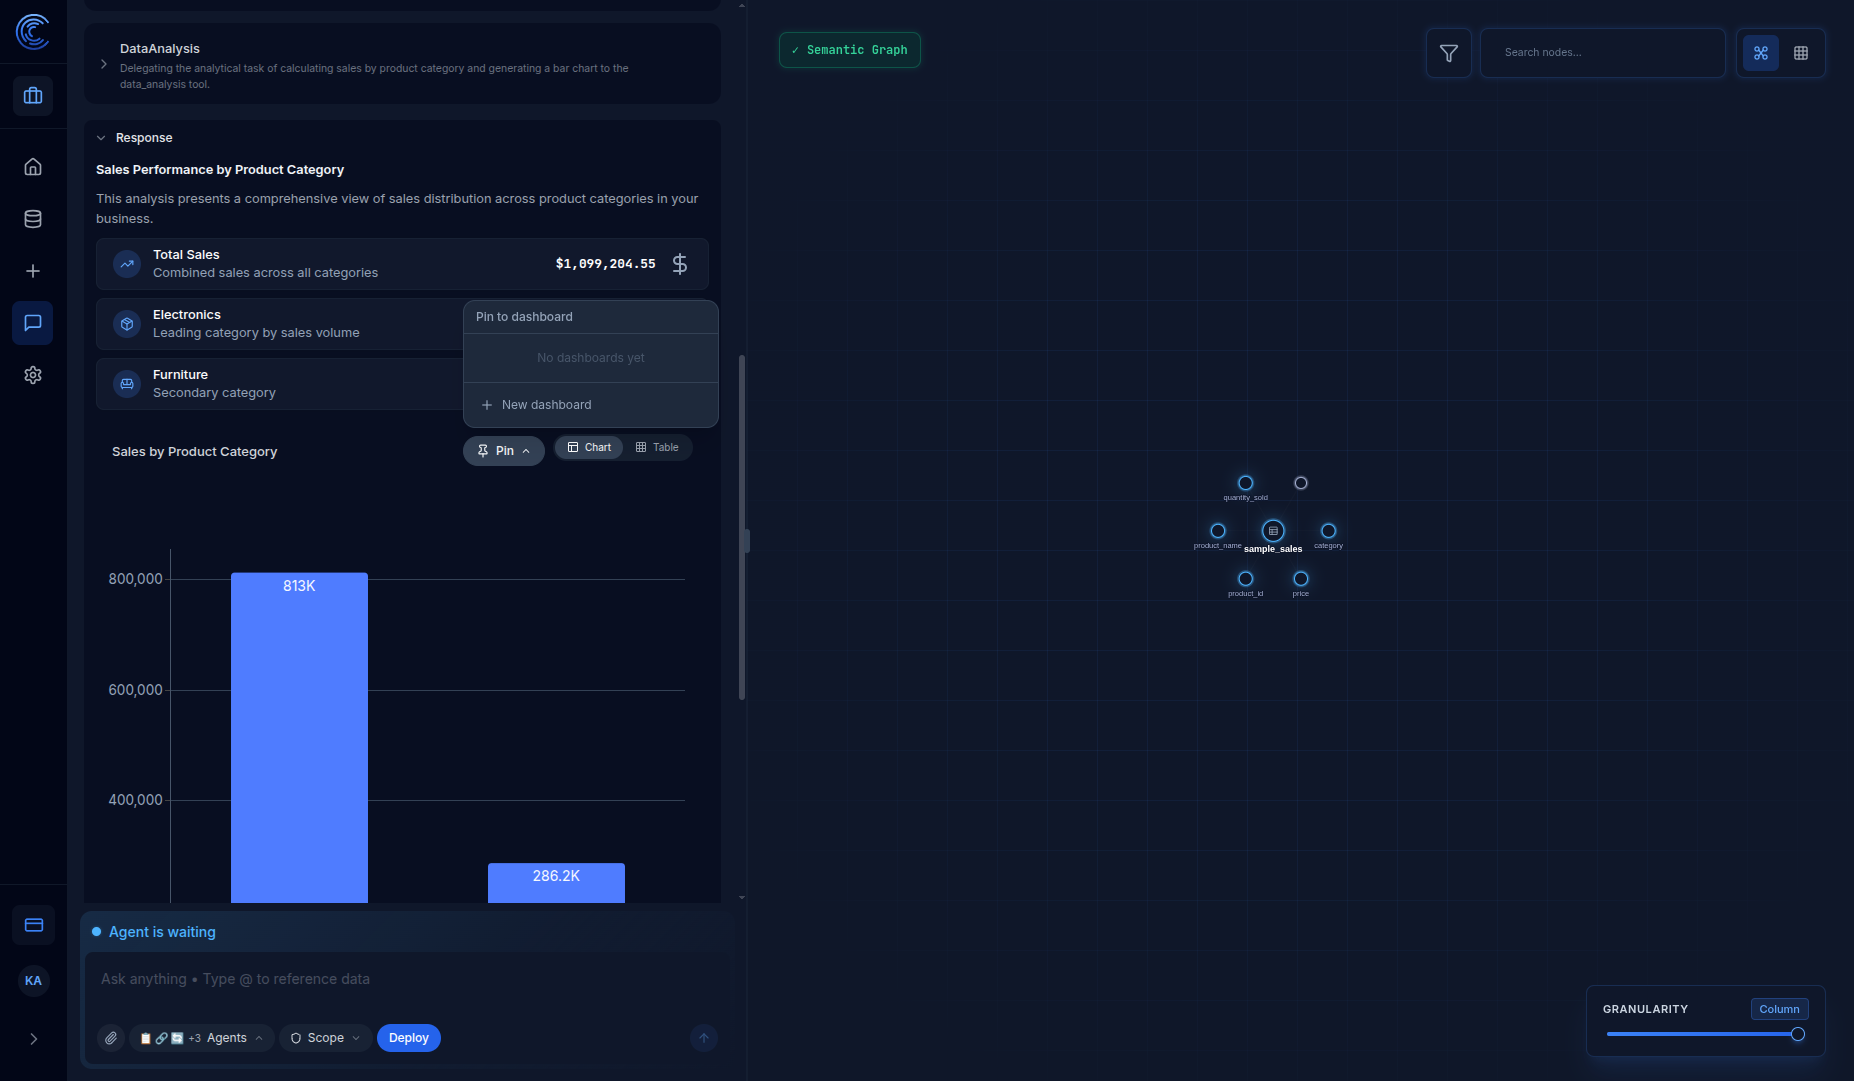
7.2 Pin the Chart to a Dashboard
Find the Pin button on the chart header and click it.
7.3 Create a New Dashboard
If no dashboards exist, you'll see "No dashboards yet". Click New dashboard.
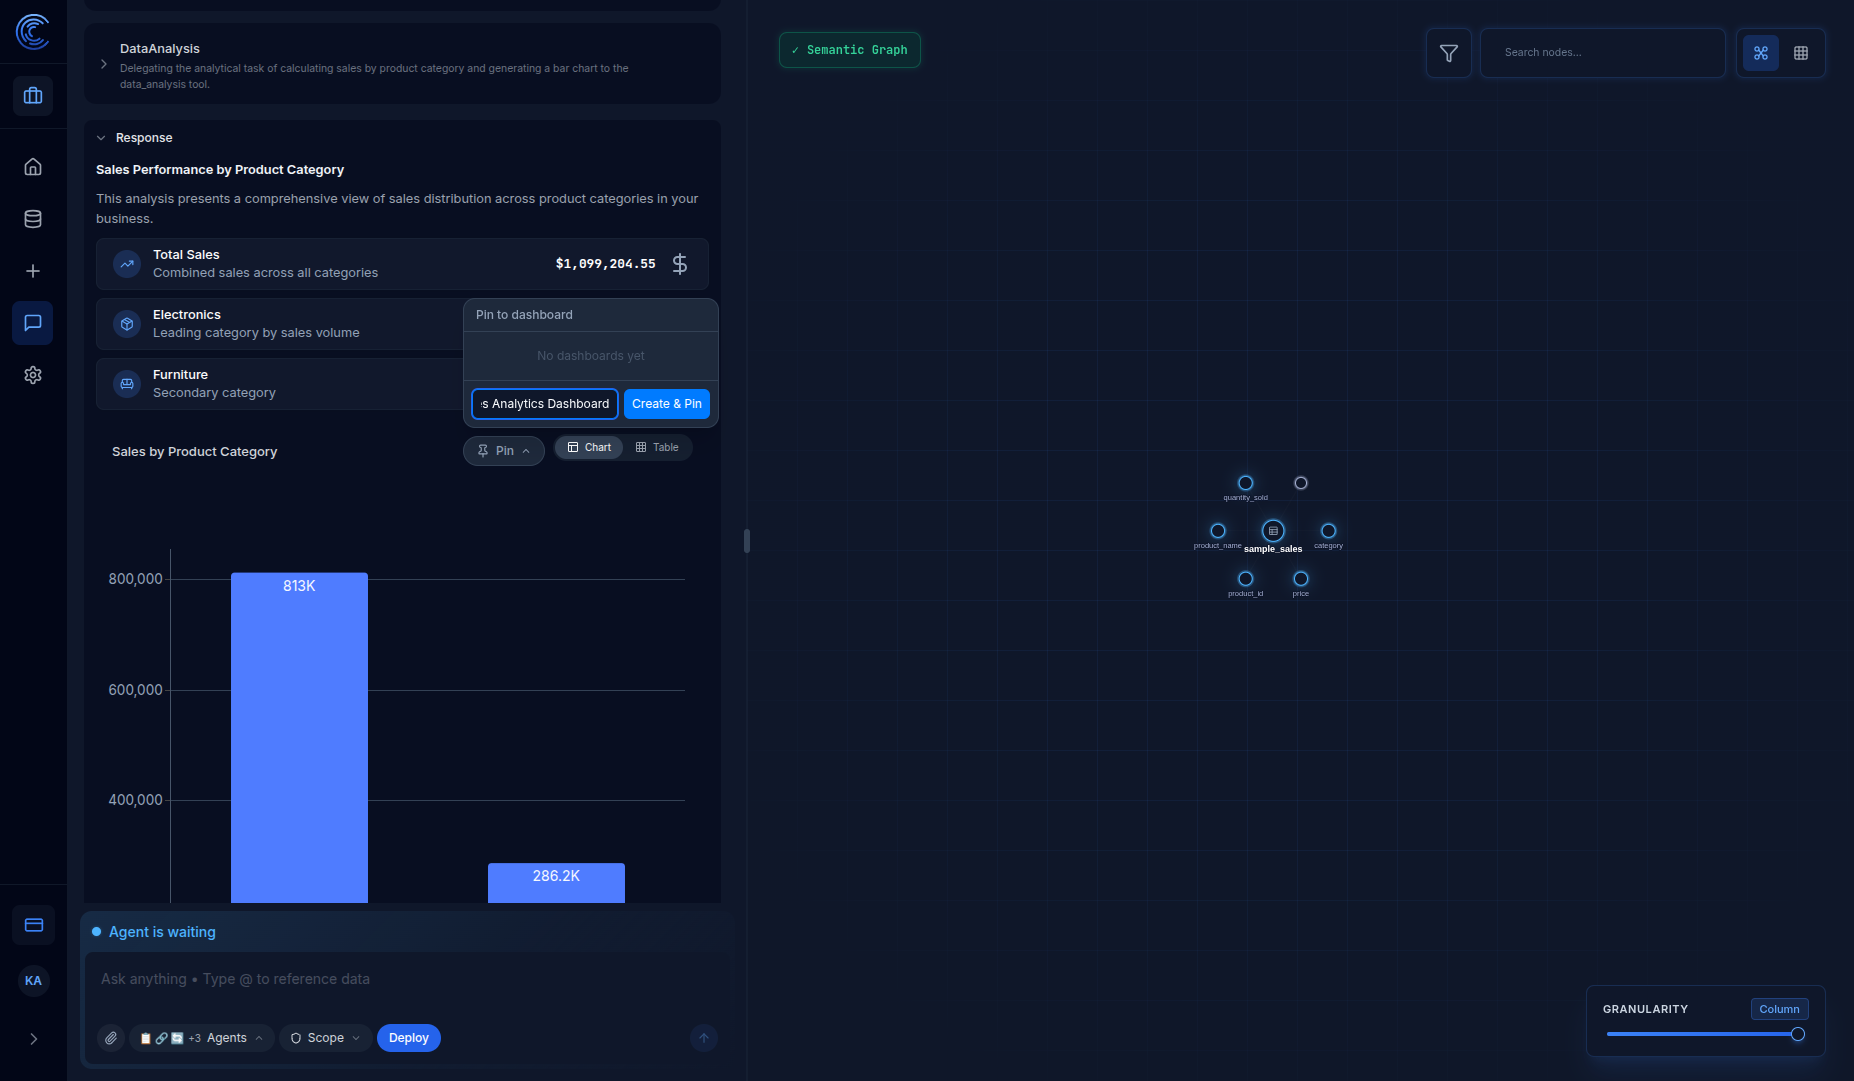
7.4 Name Your Dashboard
Enter a descriptive name for your dashboard (e.g., "Sales Analytics Dashboard") and click Create & Pin.
7.5 View Your Dashboard
Navigate to Homepage → Deployed Apps → Dashboards to see your new dashboard.
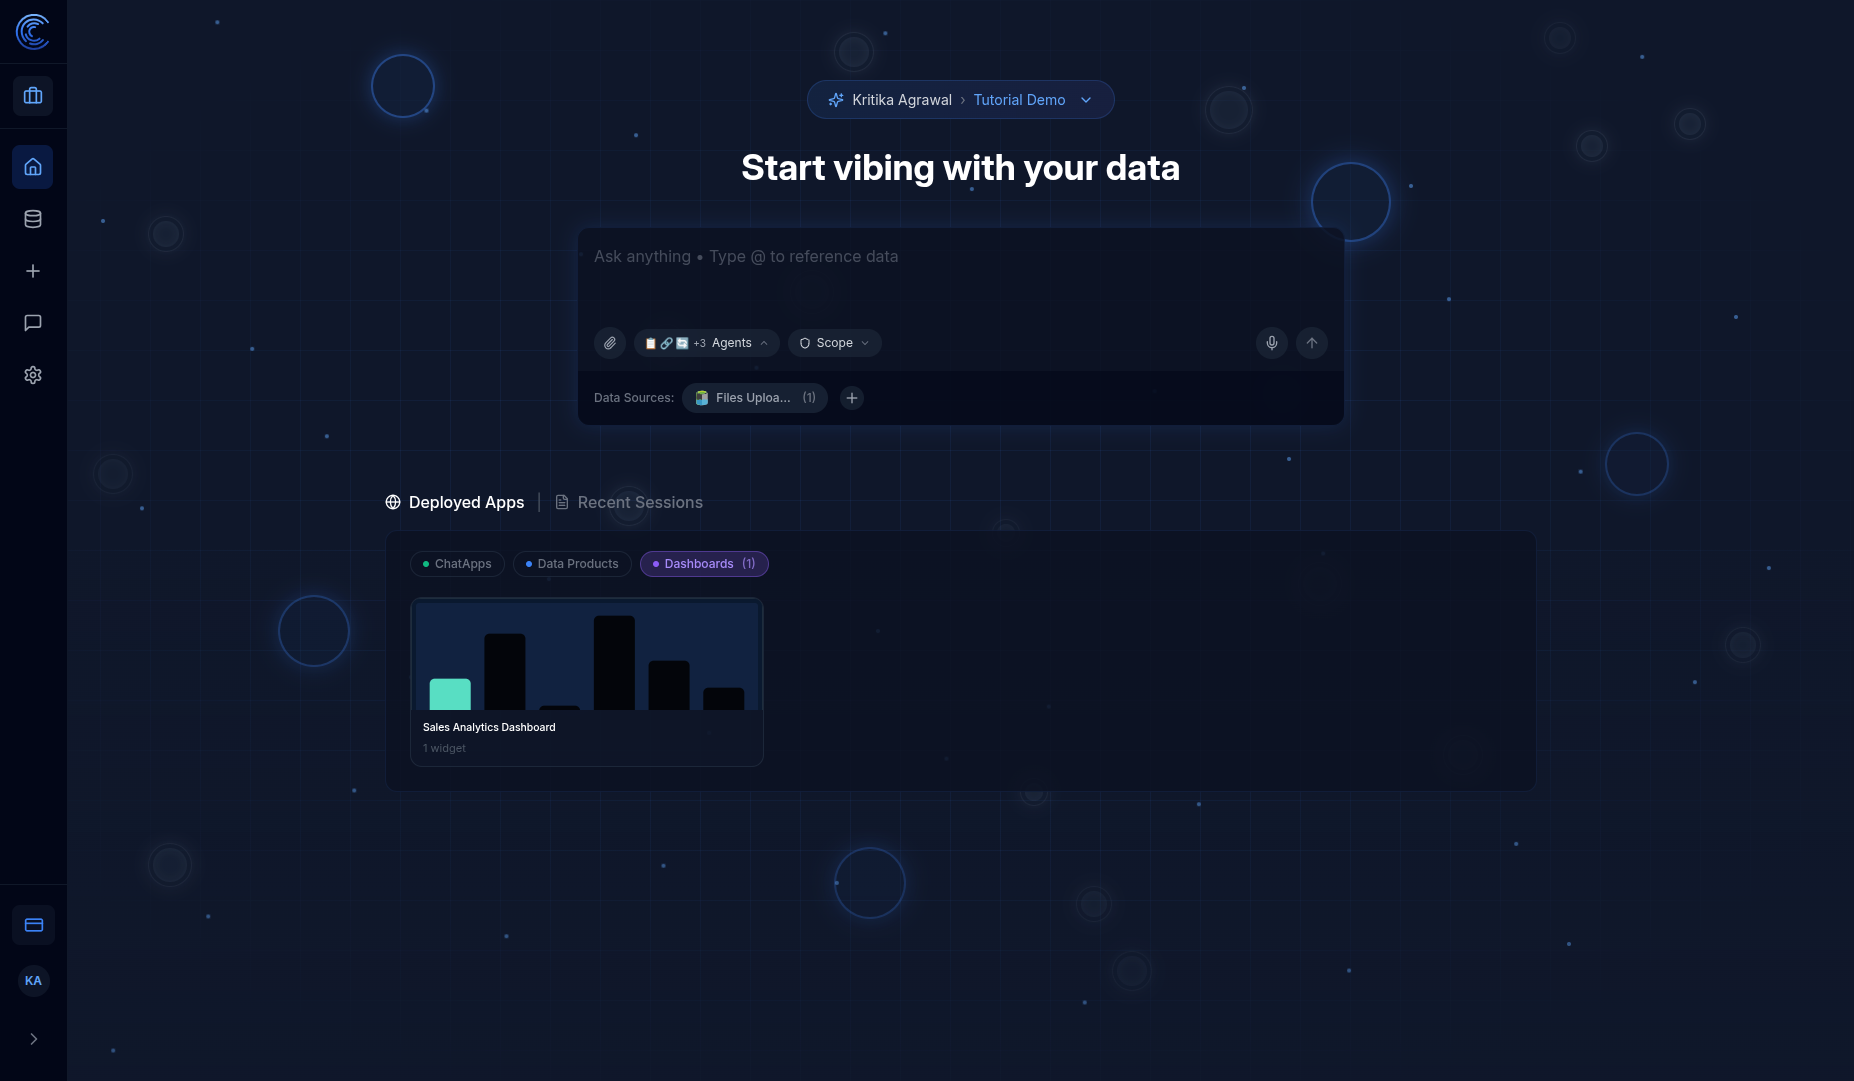
Click the dashboard to open it:
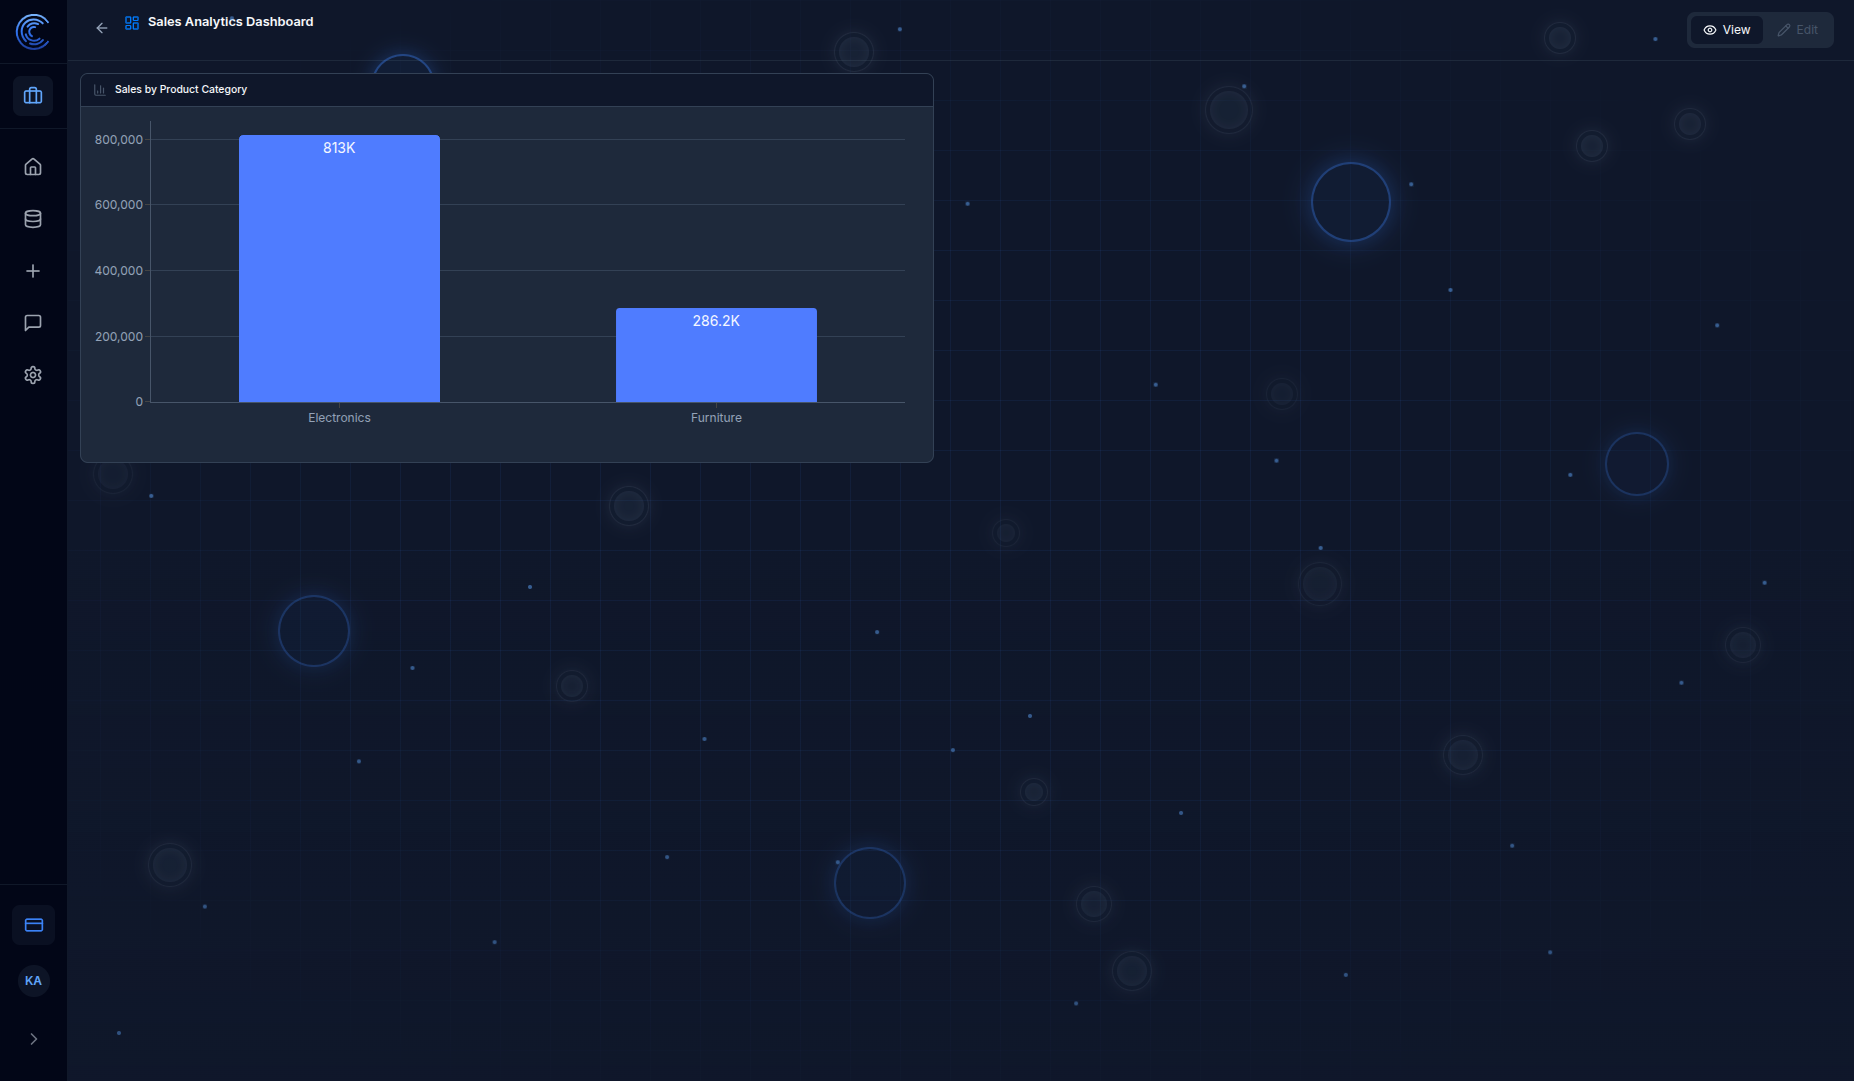
| Element | Description |
|---|---|
| Back button | Return to dashboard list |
| Dashboard name | Title of the dashboard |
| View / Edit | Toggle between view and edit modes |
| Widgets | Pinned charts and tables |
Step 8: Create a Data Product
Data Products are structured data pipelines that process and enrich your data using the Semantic Data Graph.
8.1 Start from the Semantic Data Graph
After generating your Semantic Data Graph (Step 5), you can deploy it as a Data Product.
The Semantic Data Graph agent guides you through these steps:
| Step | Description |
|---|---|
| Table Selection | Choose which tables to include |
| Business Context | Set industry vertical and domains |
| Data Profiling | Analyze data types and quality |
| Business Glossary | Generate business term definitions |
| Relationship Identification | Find primary/foreign keys |
| Domain Classification | Organize tables into business domains |
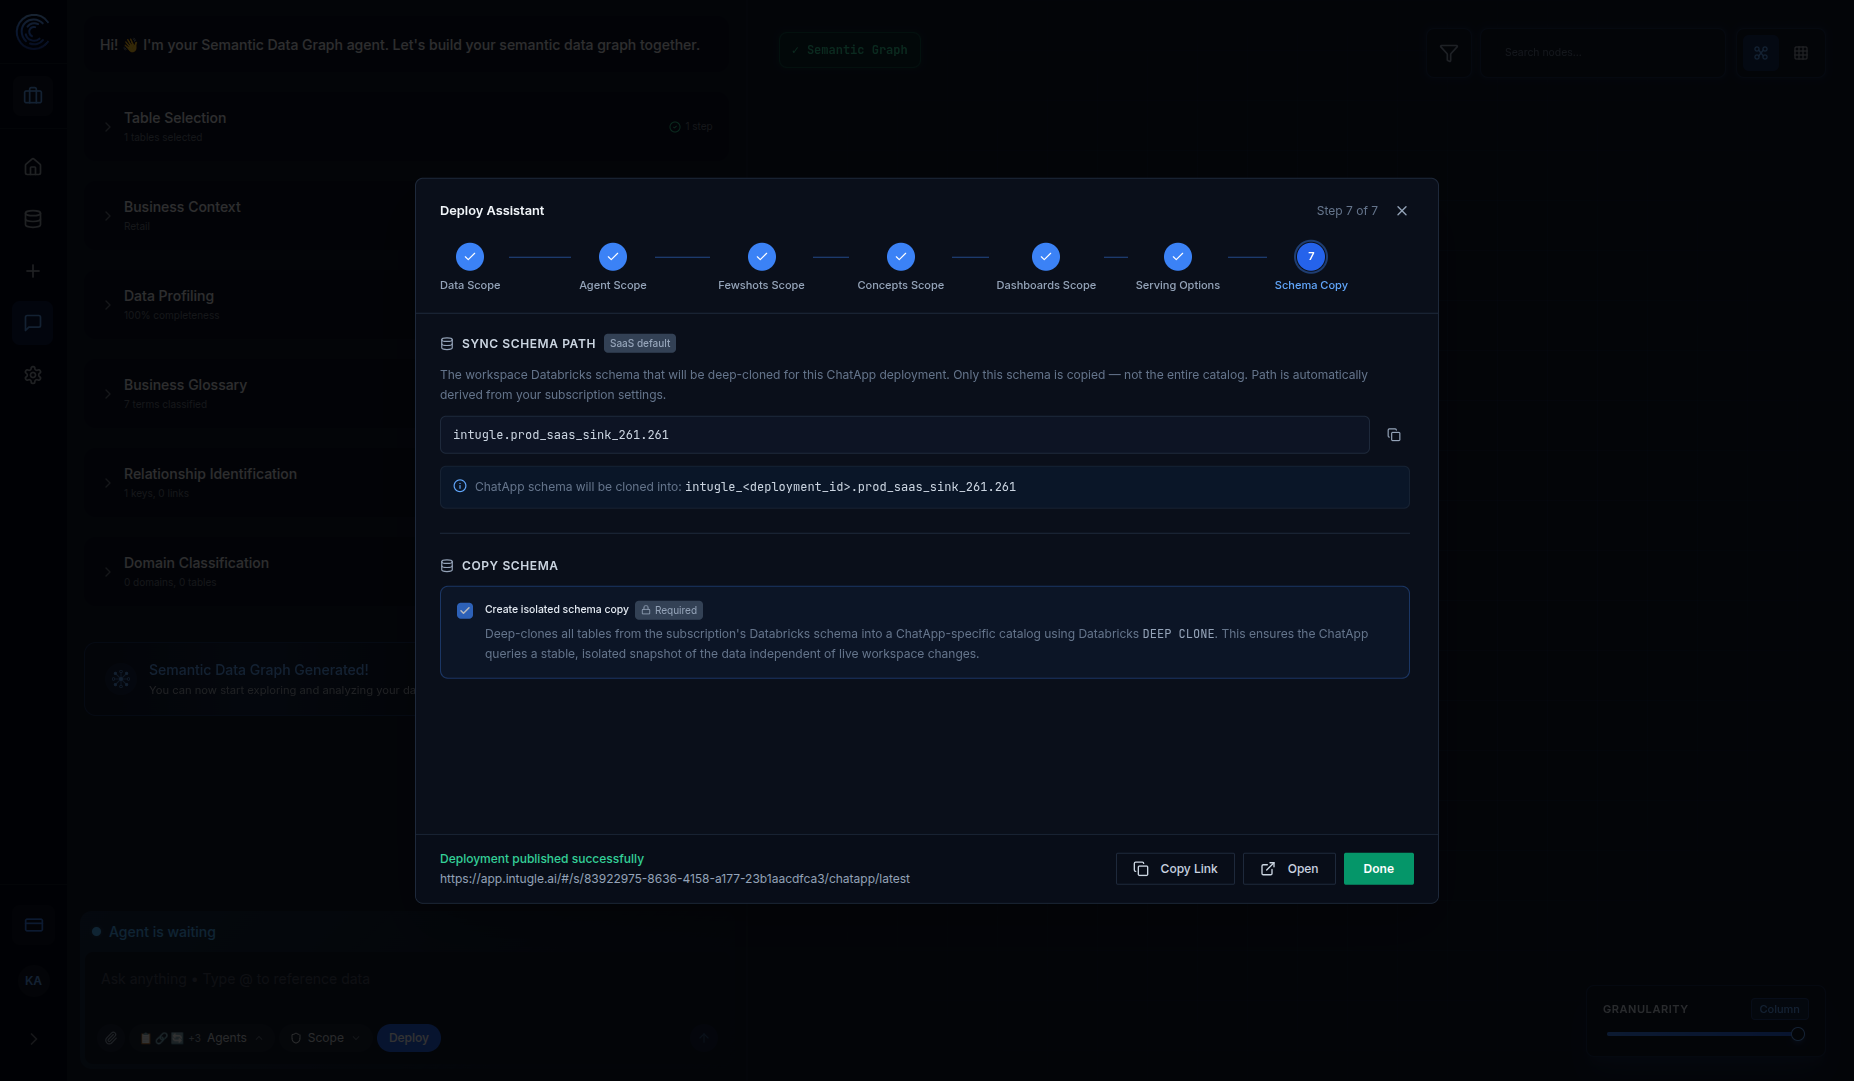
8.2 Deploy the Data Product
Click the Deploy button to publish your Data Product. The deploy wizard walks you through:
| Step | Description |
|---|---|
| Data Scope | Select which tables to include |
| Agent Scope | Choose which AI agents to enable |
| Fewshots Scope | Include example Q&A pairs |
| Concepts Scope | Include business glossary terms |
| Dashboards Scope | Include related dashboards |
| Serving Options | Configure API access |
| Schema Copy | Create isolated data copy |
Step 9: View Deployed Apps
Deployed Apps are the published, production-ready applications you create from your workspace.
9.1 Access Deployed Apps
From the Homepage, scroll down to the Deployed Apps panel below the chat input.
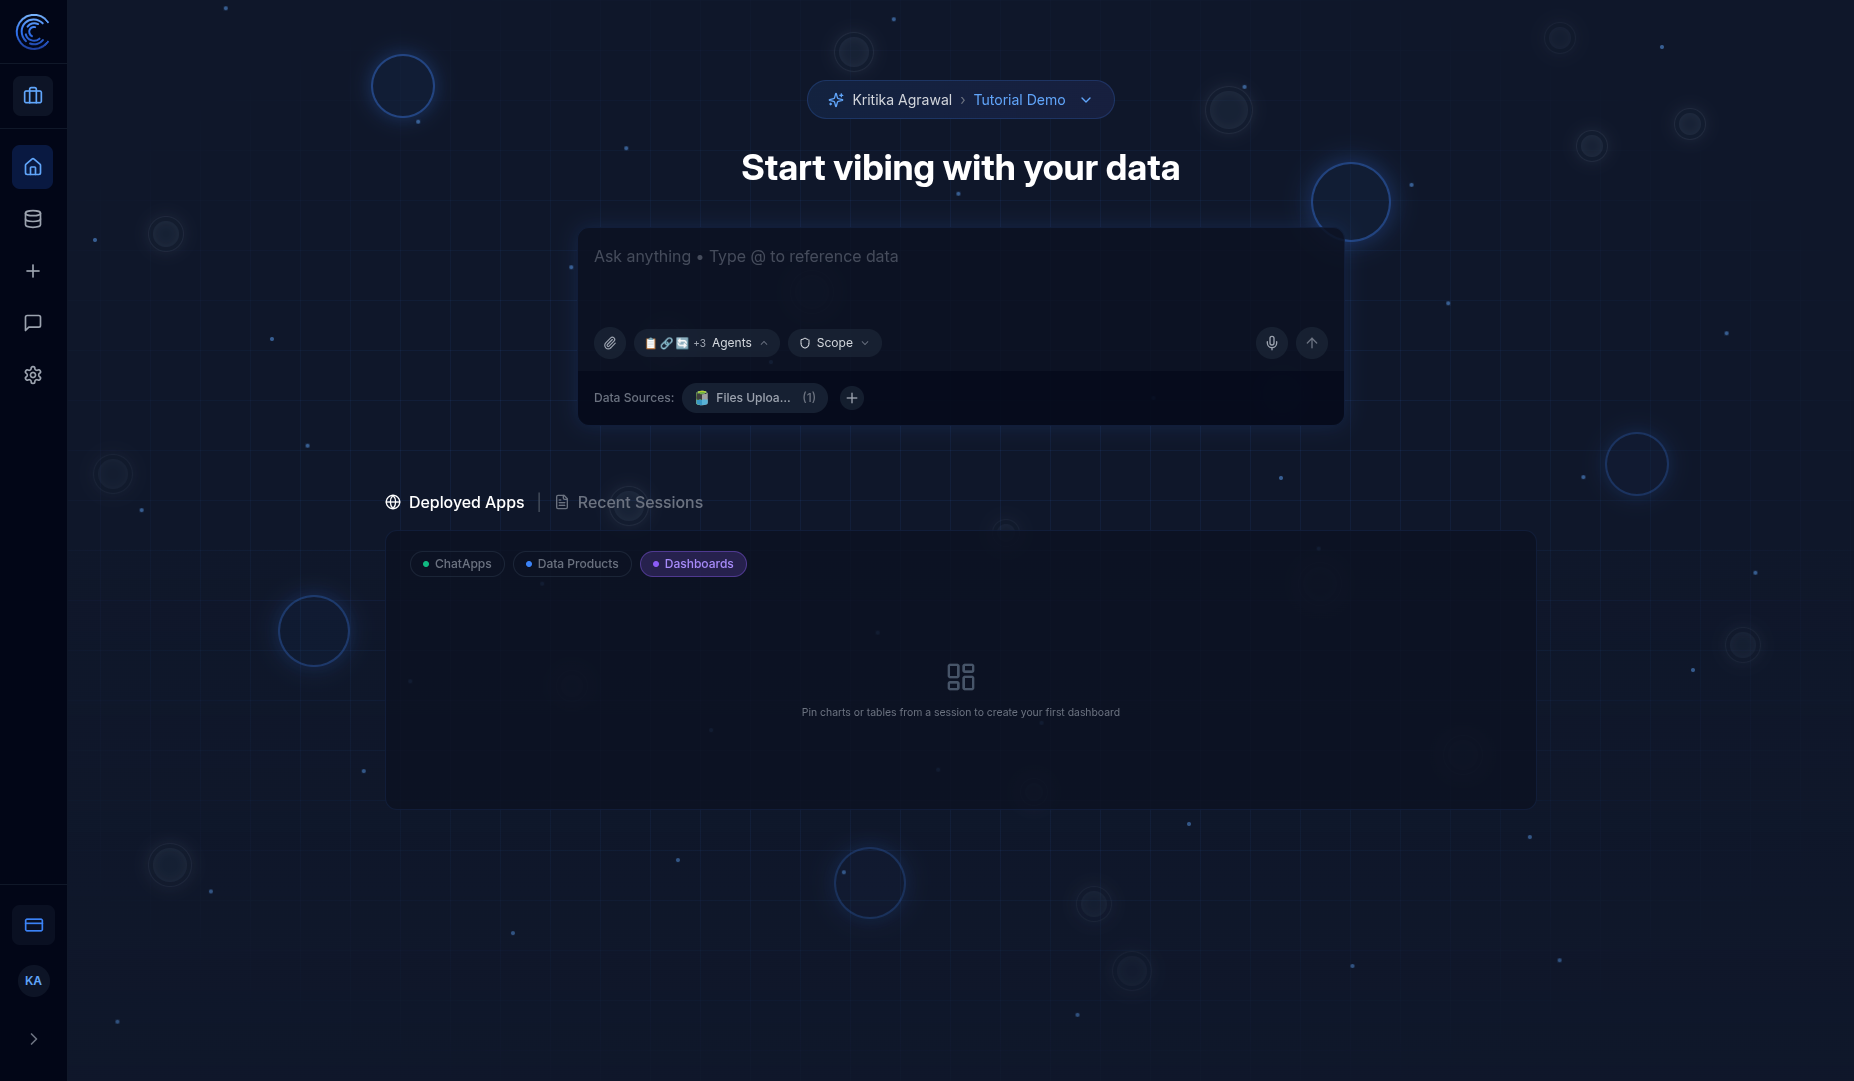
9.2 App Types
Use the tabs to filter by app type:
| App Type | Description |
|---|---|
| ChatApps | Conversational AI assistants for end-users to query data |
| Data Products | Structured data pipelines with semantic metadata |
| Dashboards | Visual analytics with pinned charts and metrics |
9.3 Open a ChatApp
Click any ChatApp card to open it. You'll see a clean chat interface:
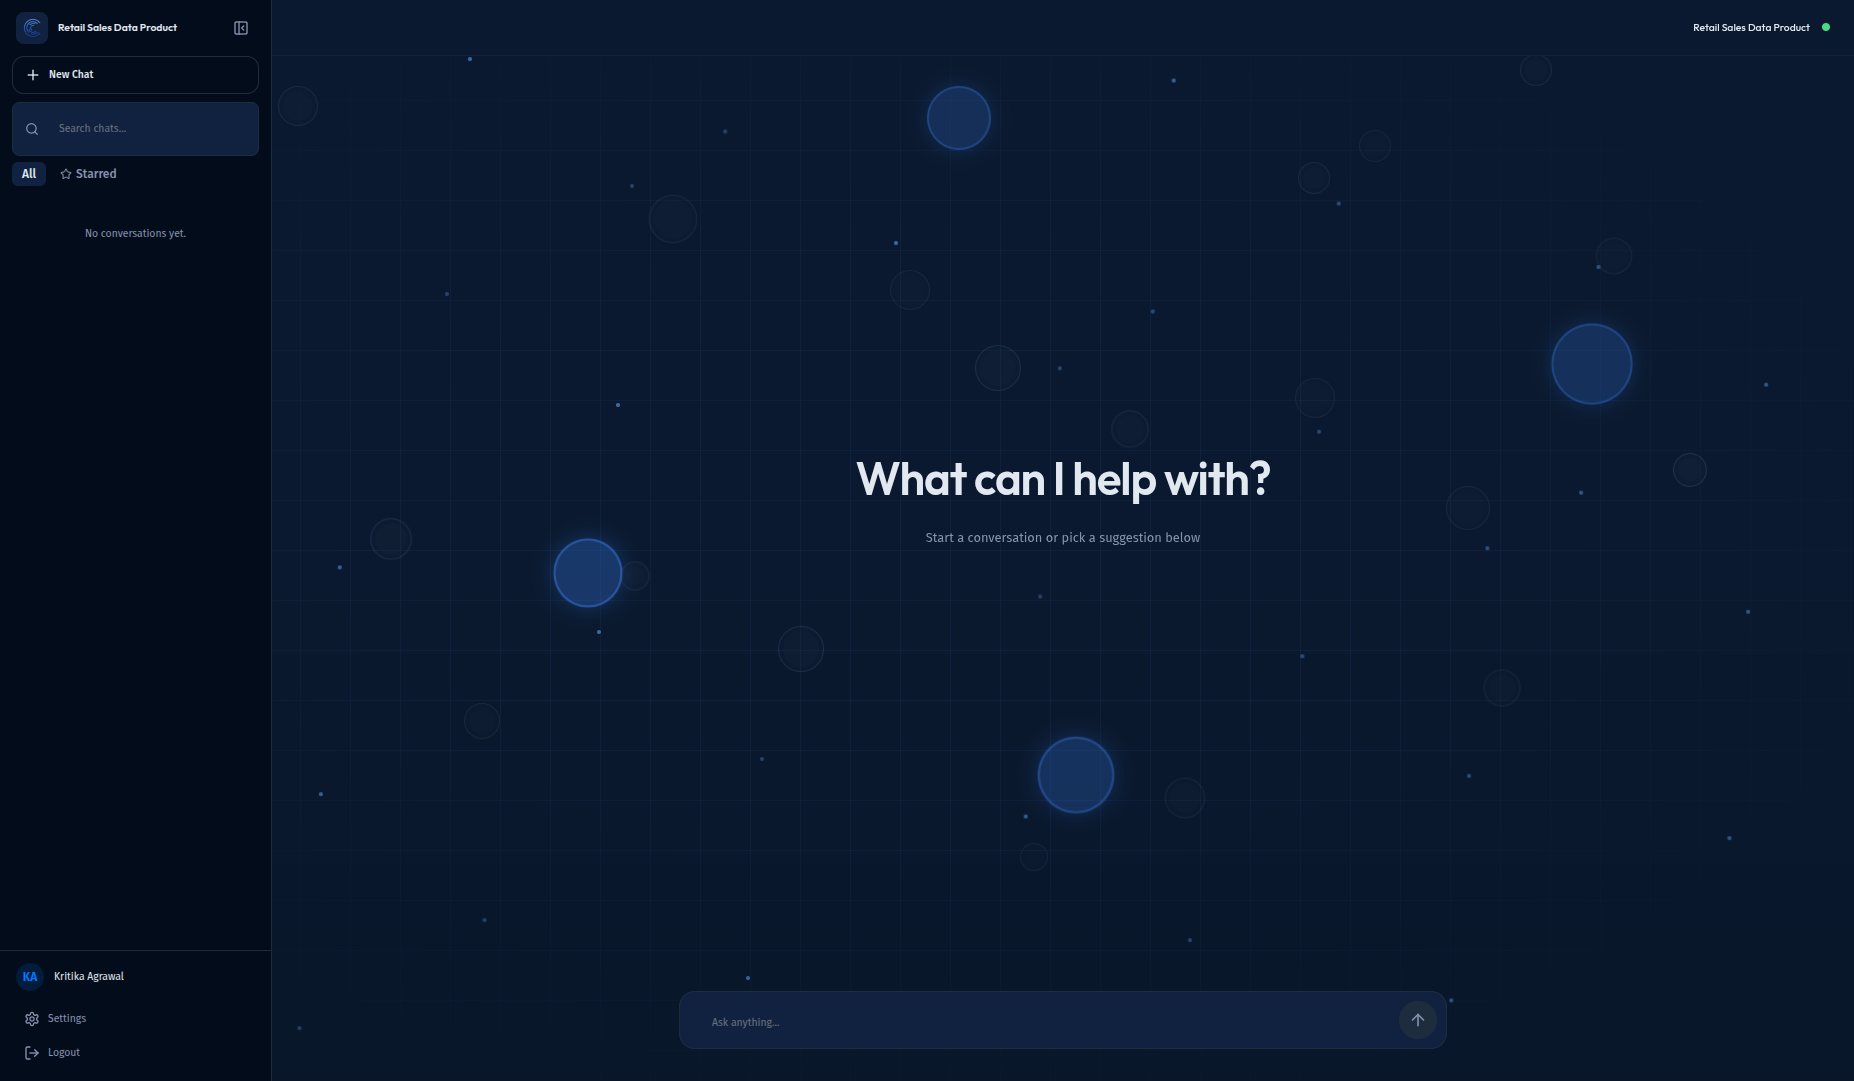
| Element | Description |
|---|---|
| Sidebar | Shows app name, New Chat button, chat history, user profile |
| Search chats | Find previous conversations |
| All / Starred | Filter chats by all or starred only |
| Settings | Access app customization (admin only) |
| Logout | Sign out of the ChatApp |
| Main area | Chat interface with welcome message |
| Status badge | Shows "Connected" when ready |
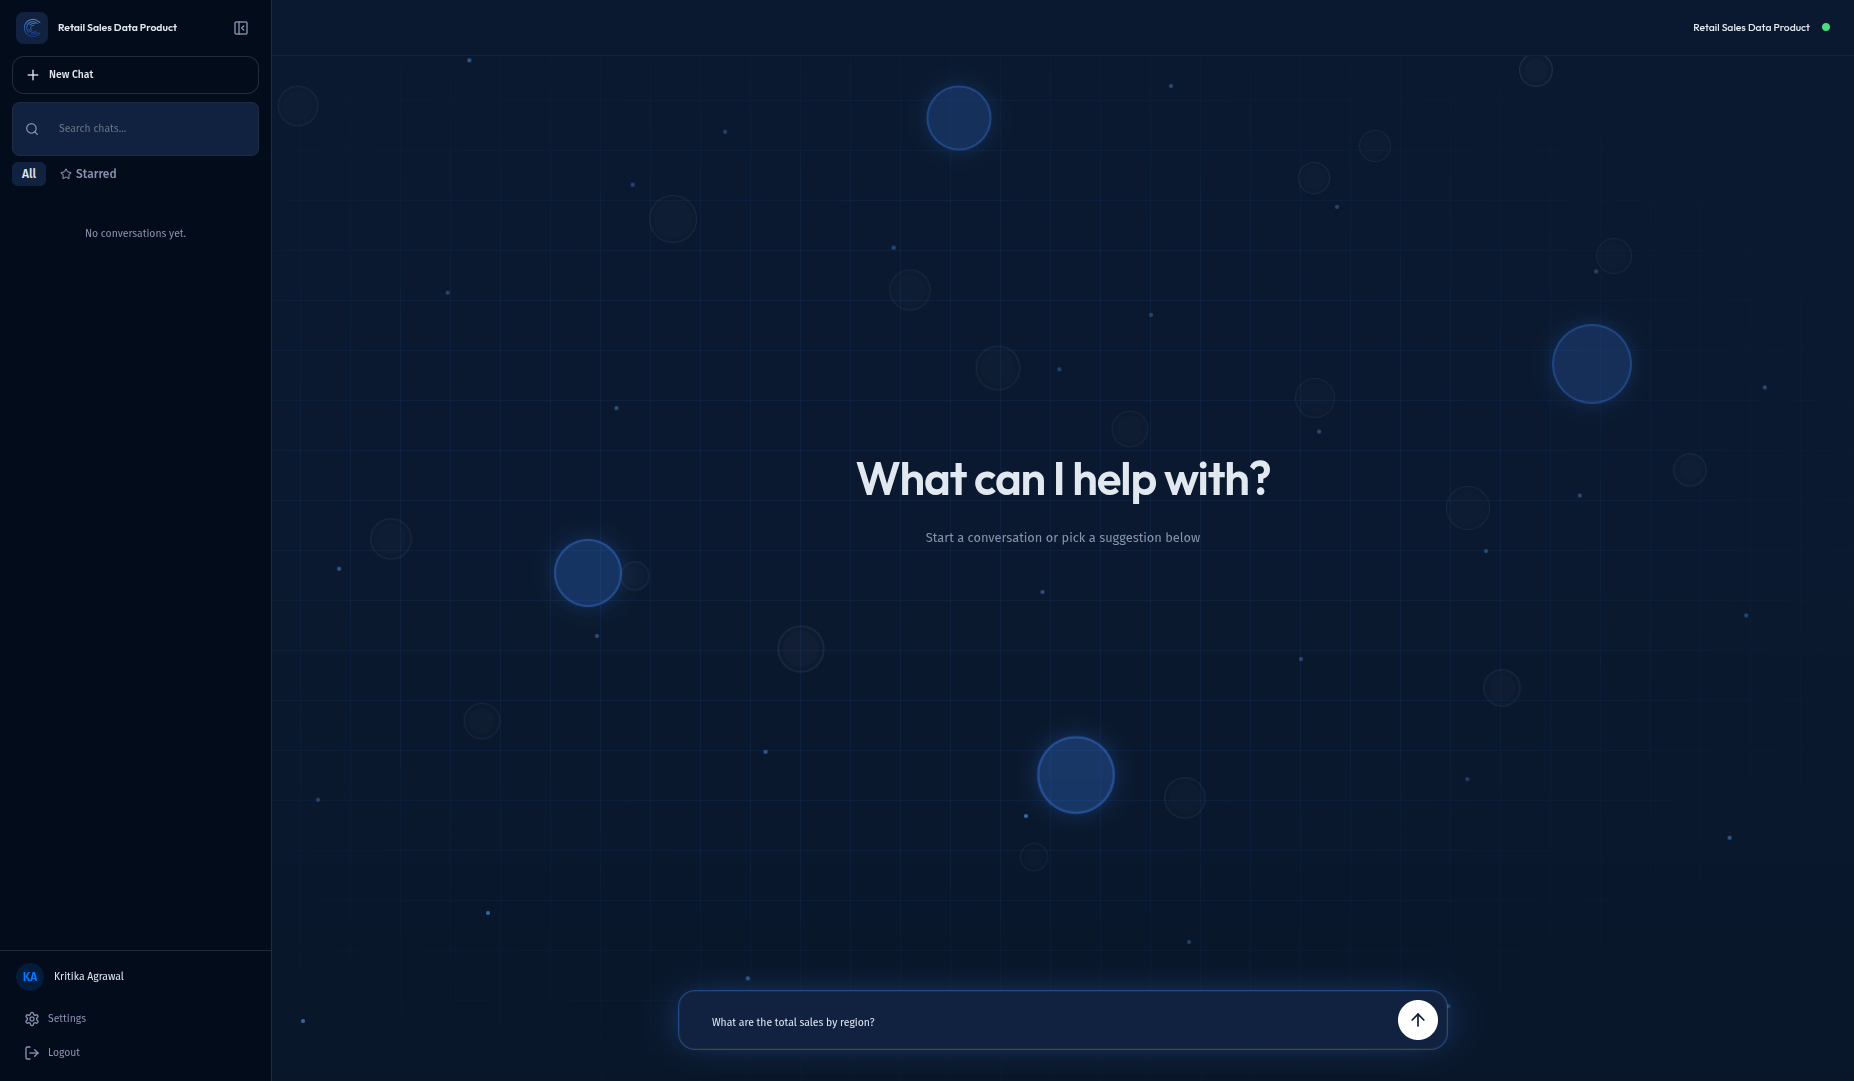
9.4 Ask Questions in ChatApp
Type your question in the "Ask anything..." input and press Enter.
The AI processes your question and returns a comprehensive response:
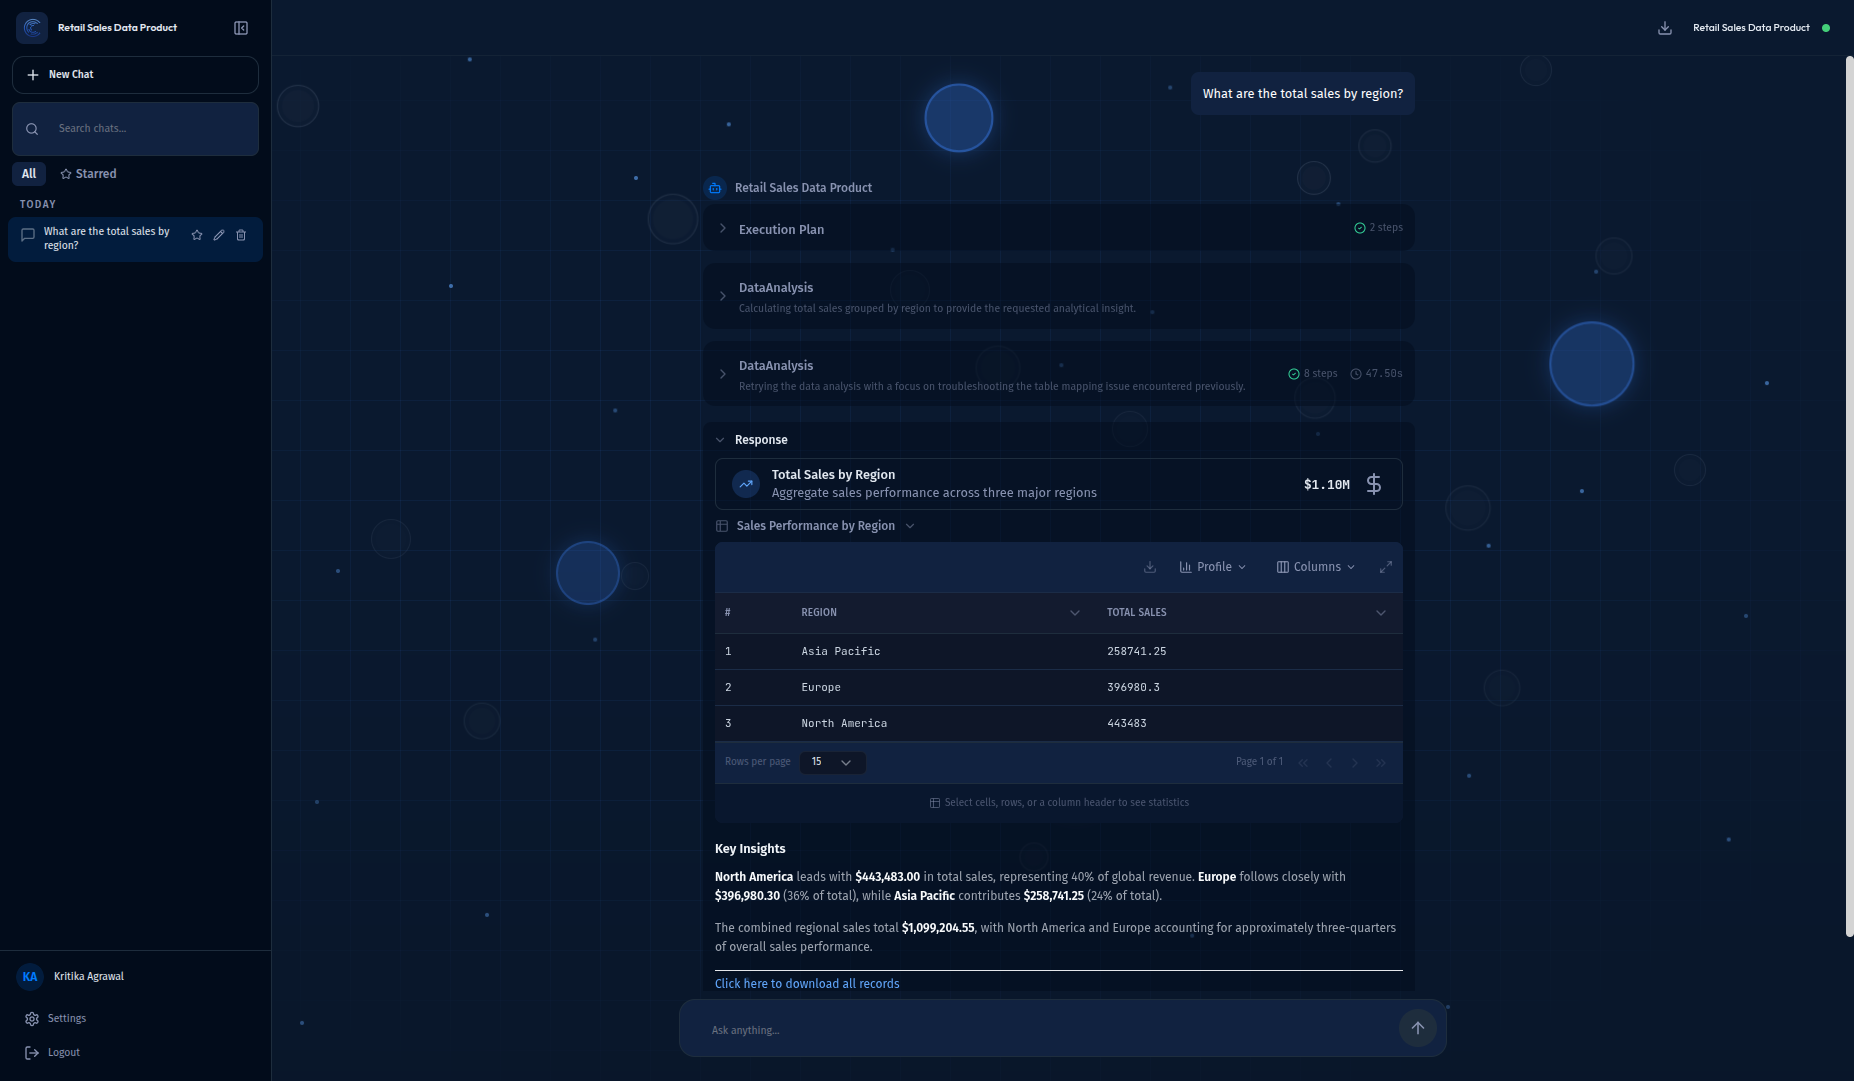
| Component | Description |
|---|---|
| Execution Plan | Shows the steps the AI will take |
| DataAnalysis | Shows data analysis in progress with timing |
| SQL Query | The generated SQL query (expandable) |
| Data Table | Results displayed in a table format |
| Key Insights | AI-generated analysis and insights |
| Download link | Export all records as a file |
Step 10: Configure ChatApp Settings
Administrators can customize the ChatApp appearance and behavior.
10.1 Open Settings
Click Settings in the ChatApp sidebar to open the settings panel.
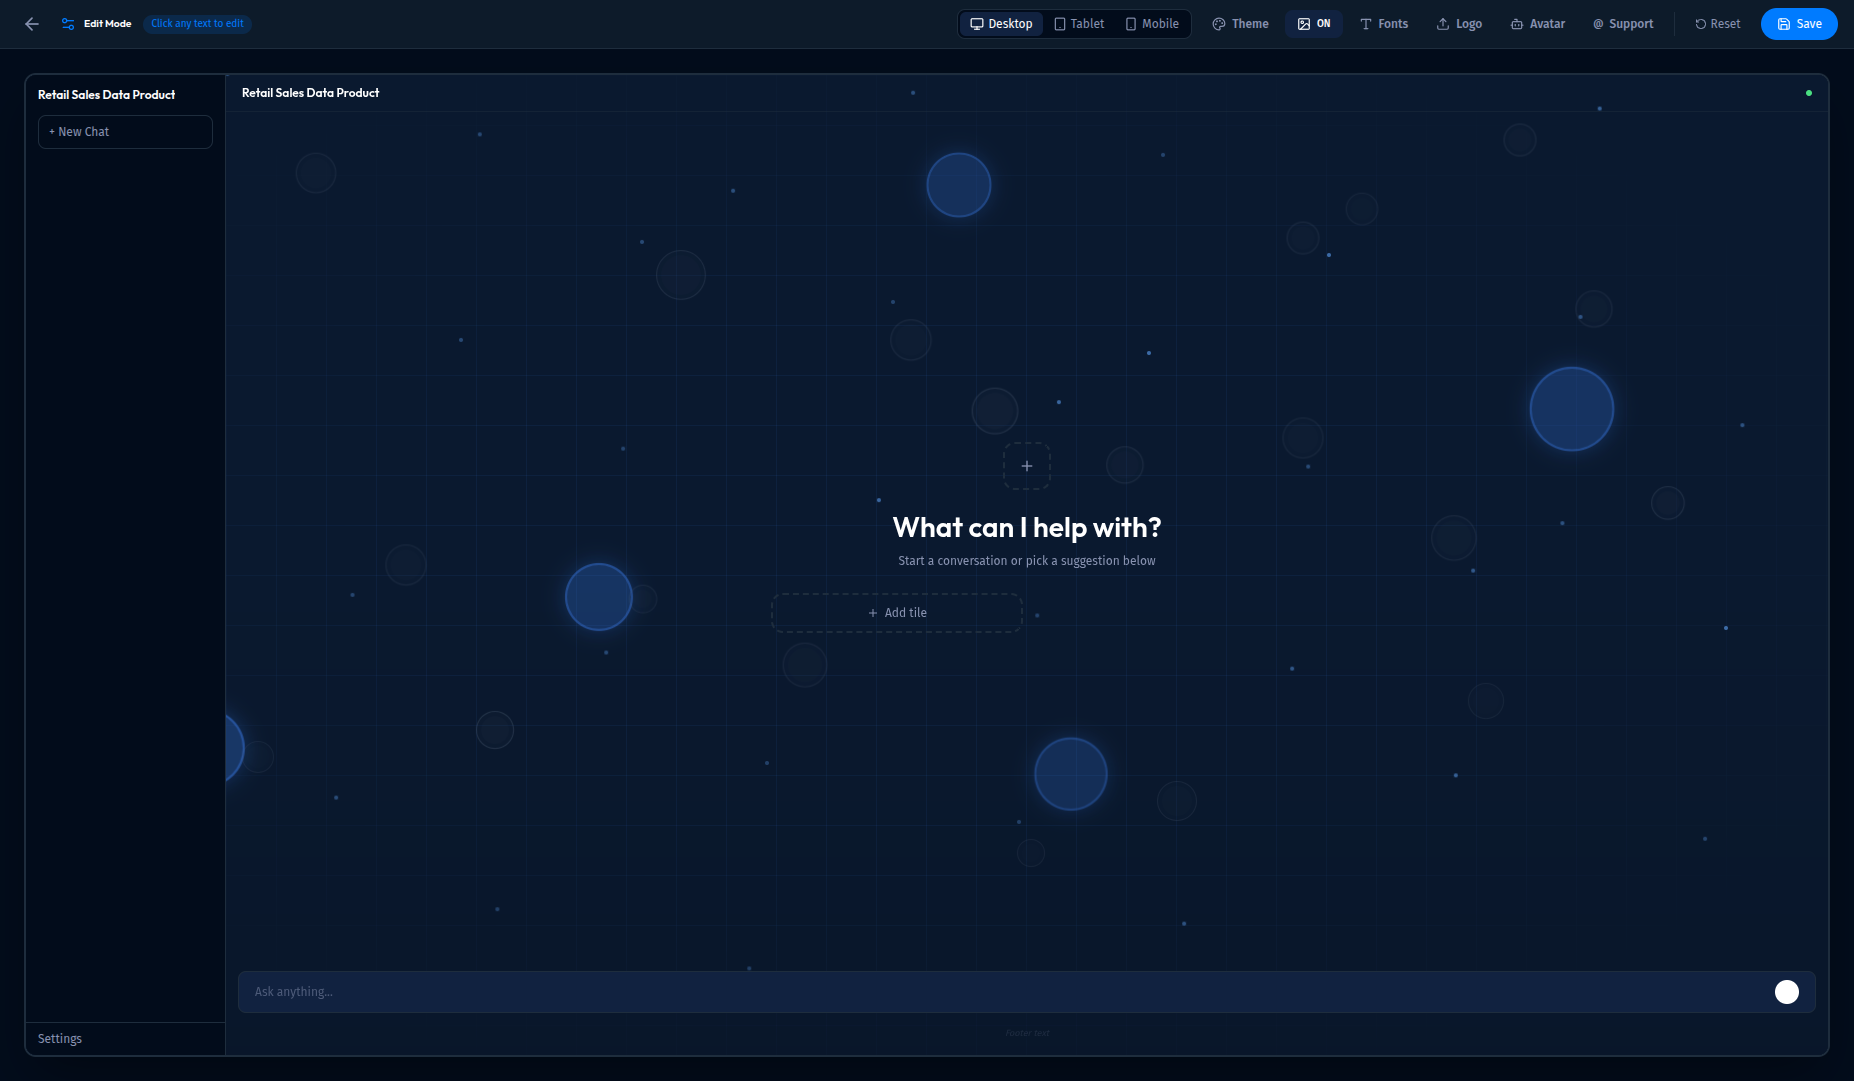
Settings Toolbar
| Section | Options |
|---|---|
| Preview Mode | Desktop, Tablet, Mobile views |
| Theme | Color theme presets |
| ON/OFF | Toggle background graphics |
| Fonts | Heading and body font selection |
| Logo | Upload custom logo |
| Avatar | AI assistant icon |
| Support | Support email configuration |
| Reset | Restore default settings |
| Save | Save changes |
10.2 Theme Settings
Click Theme to choose from 6 preset color themes:
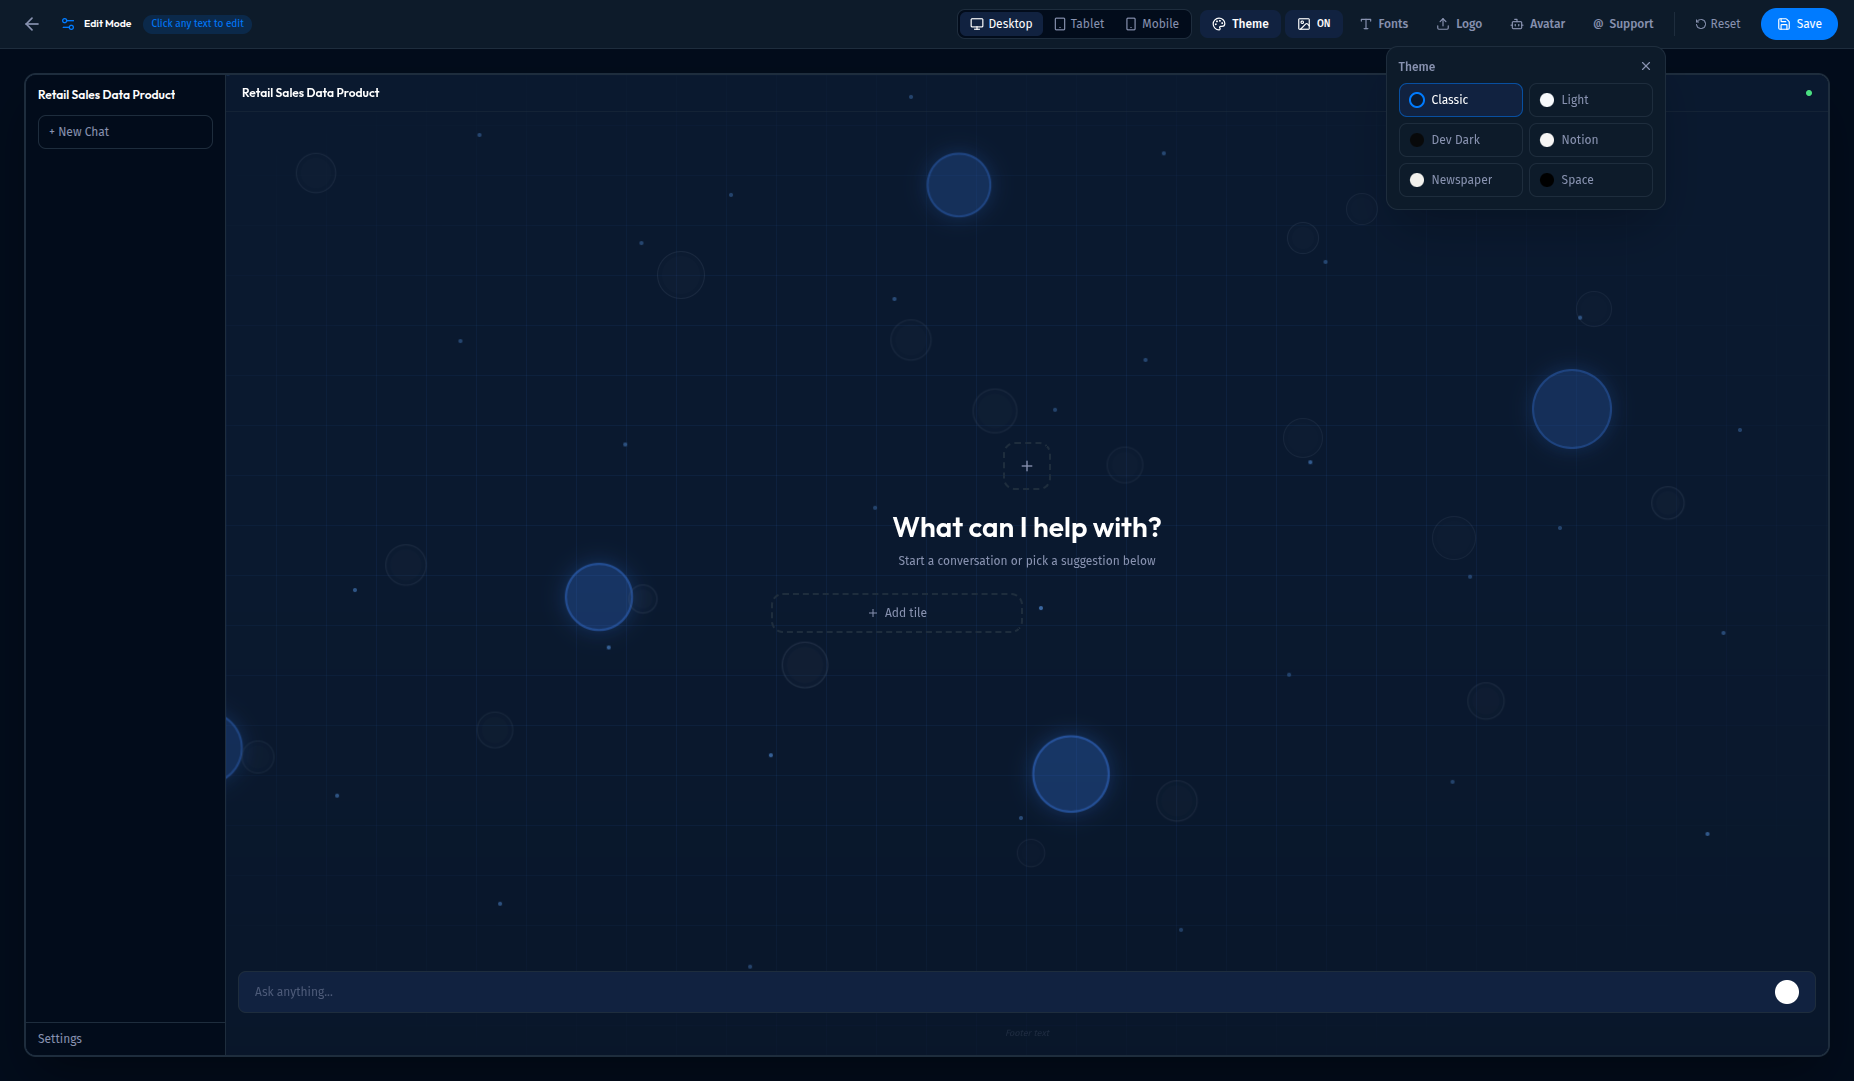
| Theme | Description |
|---|---|
| Classic | Default Intugle theme |
| Light | Light mode with white background |
| Dev Dark | Developer-friendly dark theme |
| Notion | Notion-inspired clean design |
| Newspaper | Print/newspaper style |
| Space | Space-themed dark mode |
10.3 Font Settings
Click Fonts to customize typography:
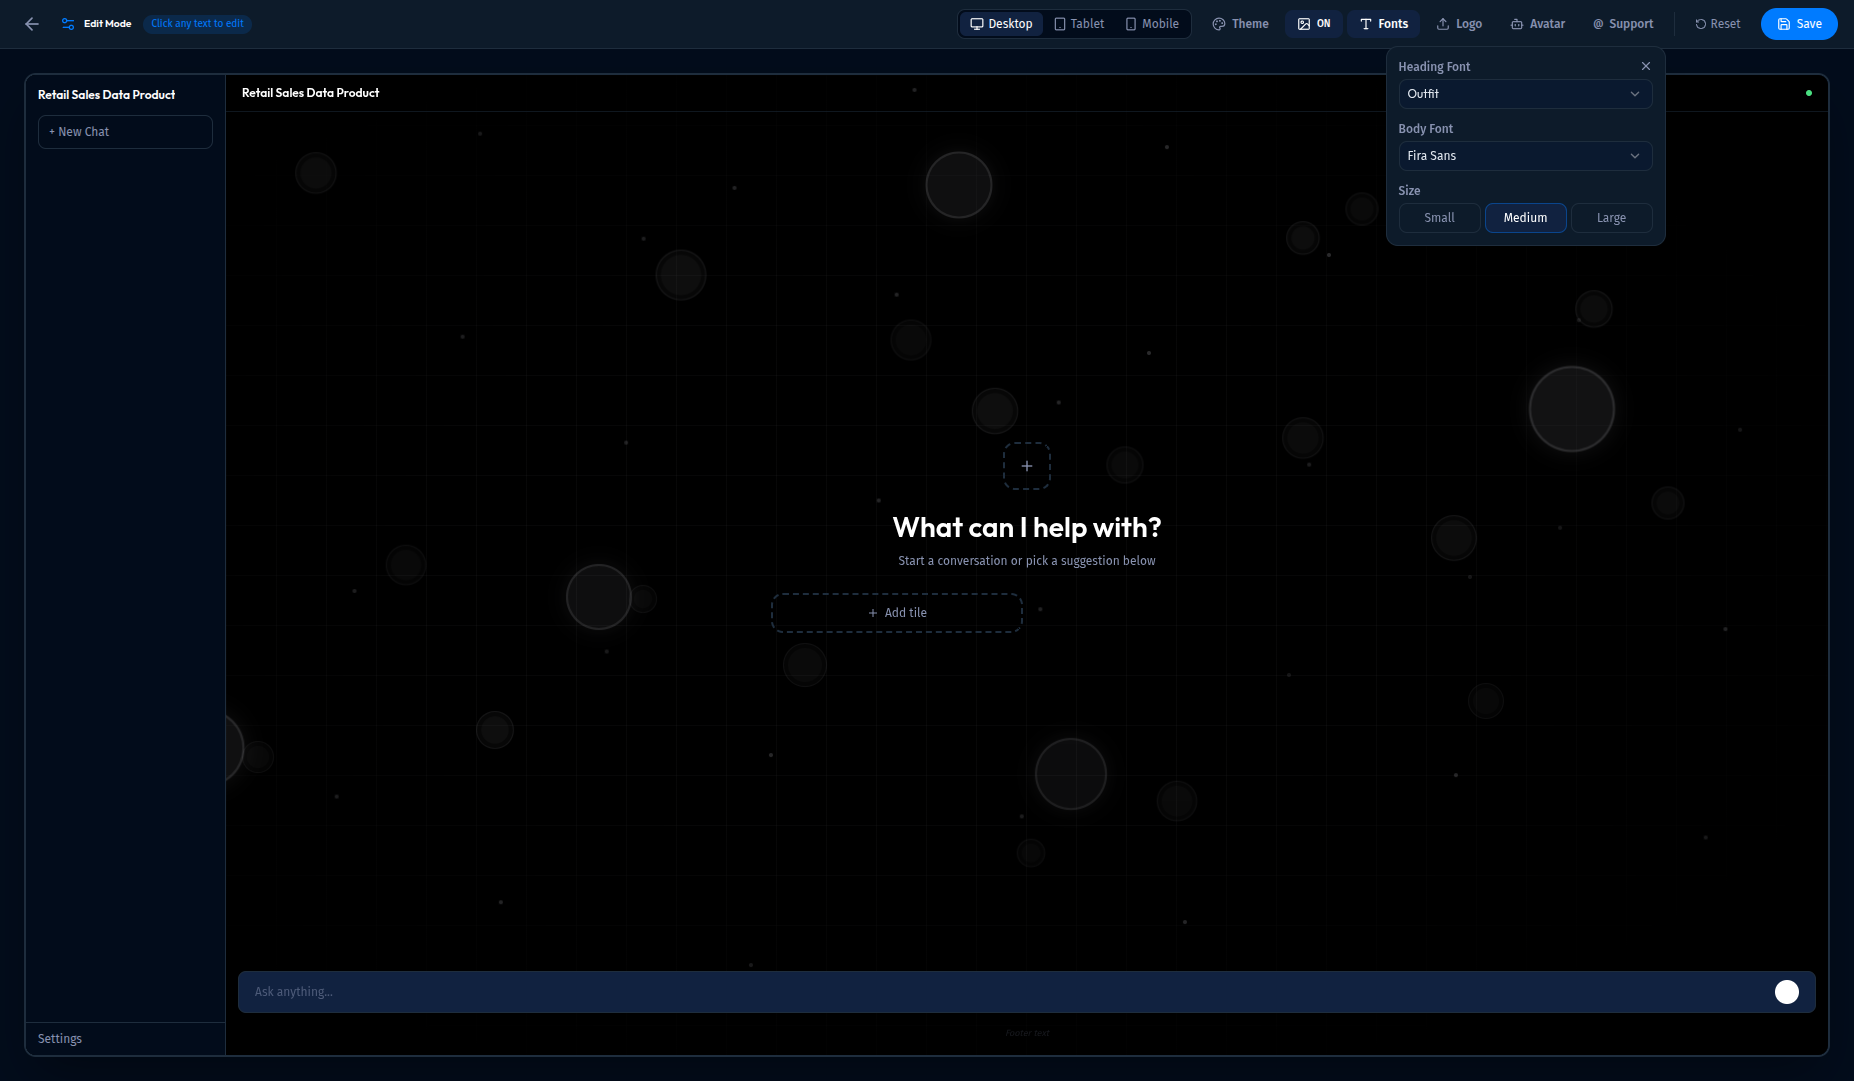
| Setting | Options |
|---|---|
| Heading Font | Outfit, Inter, Space Grotesk, Poppins, DM Sans, Playfair Display, Merriweather, Sora, Plus Jakarta Sans, Bricolage Grotesque, Raleway, Montserrat |
| Body Font | Fira Sans, Inter, Source Sans 3, DM Sans, Nunito, Lato, Open Sans, IBM Plex Sans, Work Sans, Karla, Roboto, Noto Sans |
| Size | Small, Medium, Large |
10.4 Logo Settings
Click Logo to upload your company logo:
![]()
- Click Upload to select an image file
- The logo appears in the ChatApp header and sidebar
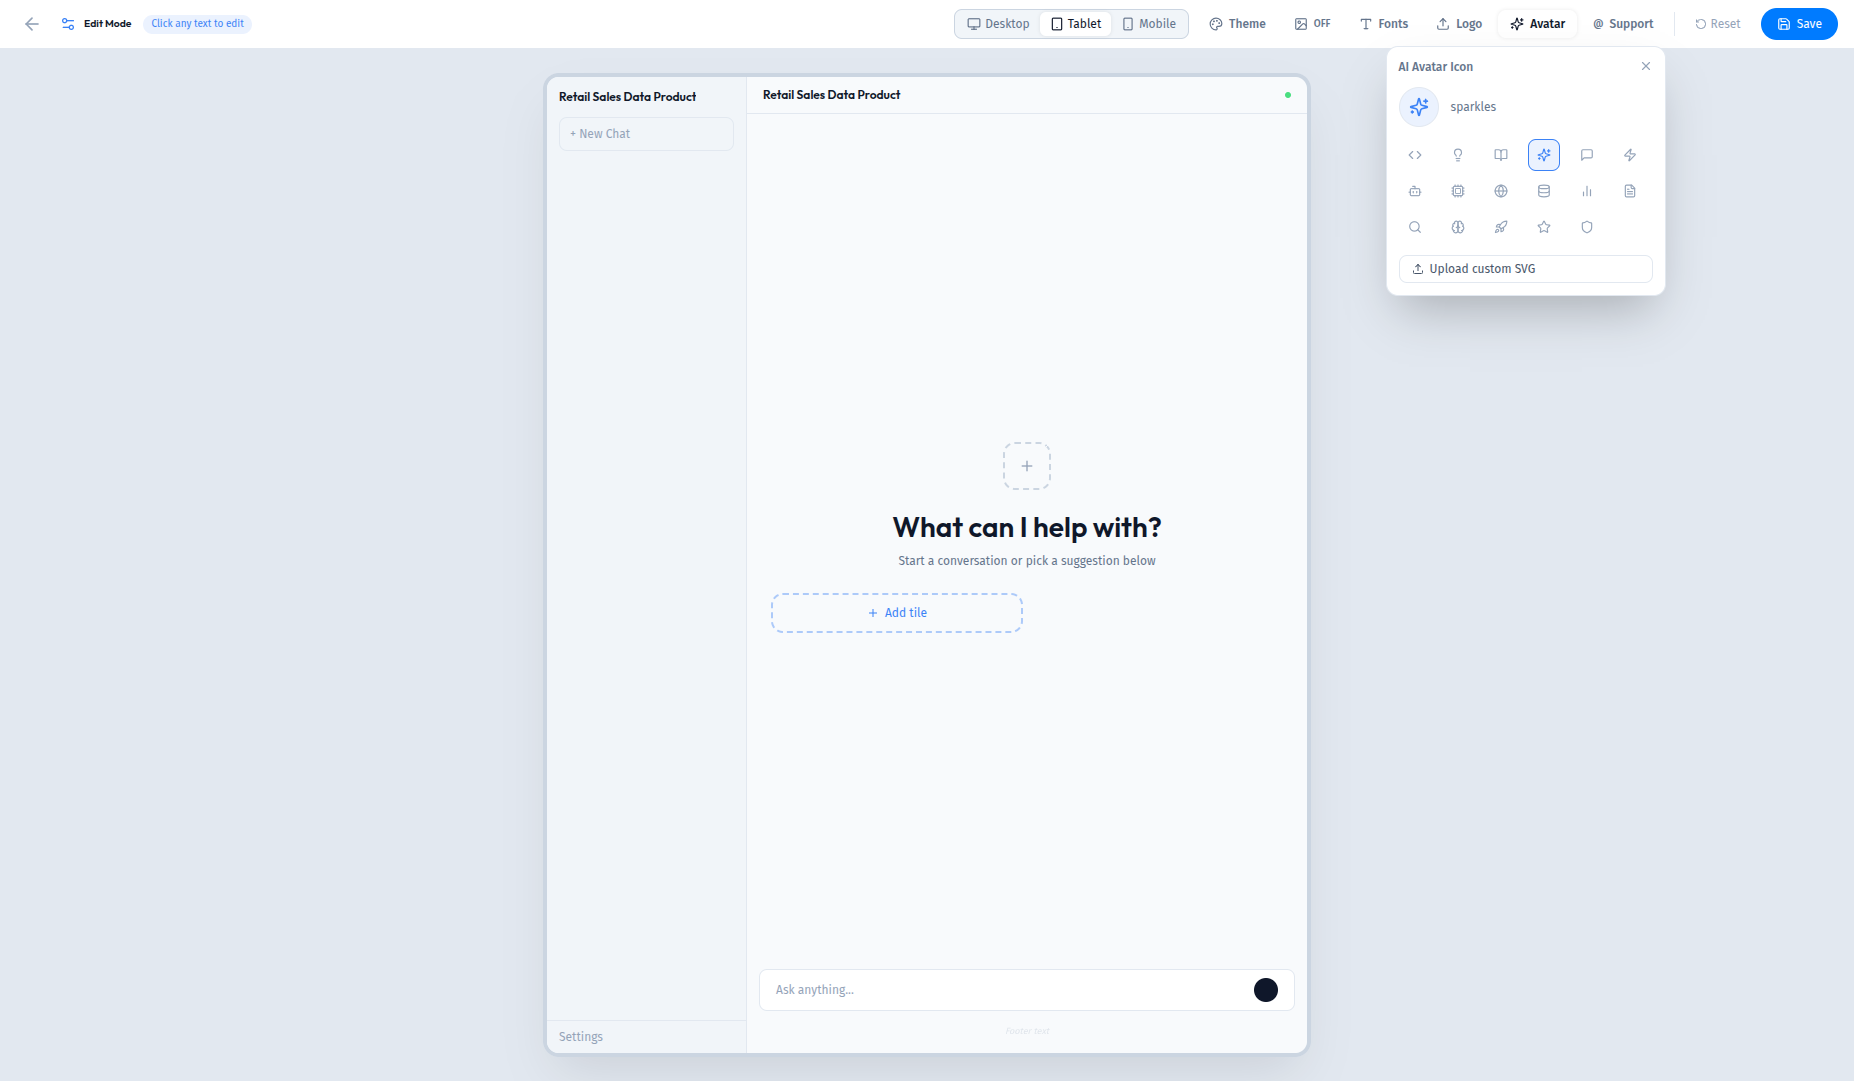
10.5 Avatar Settings
Click Avatar to customize the AI assistant icon:
![]()
Choose from 17 preset icons:
- code, lightbulb, book, sparkles, message, zap, bot, cpu, globe, database, chart, file, search, brain, rocket, star, shield
Or click Upload custom SVG to use your own icon.
10.6 Support Settings
Click Support to configure help contact:
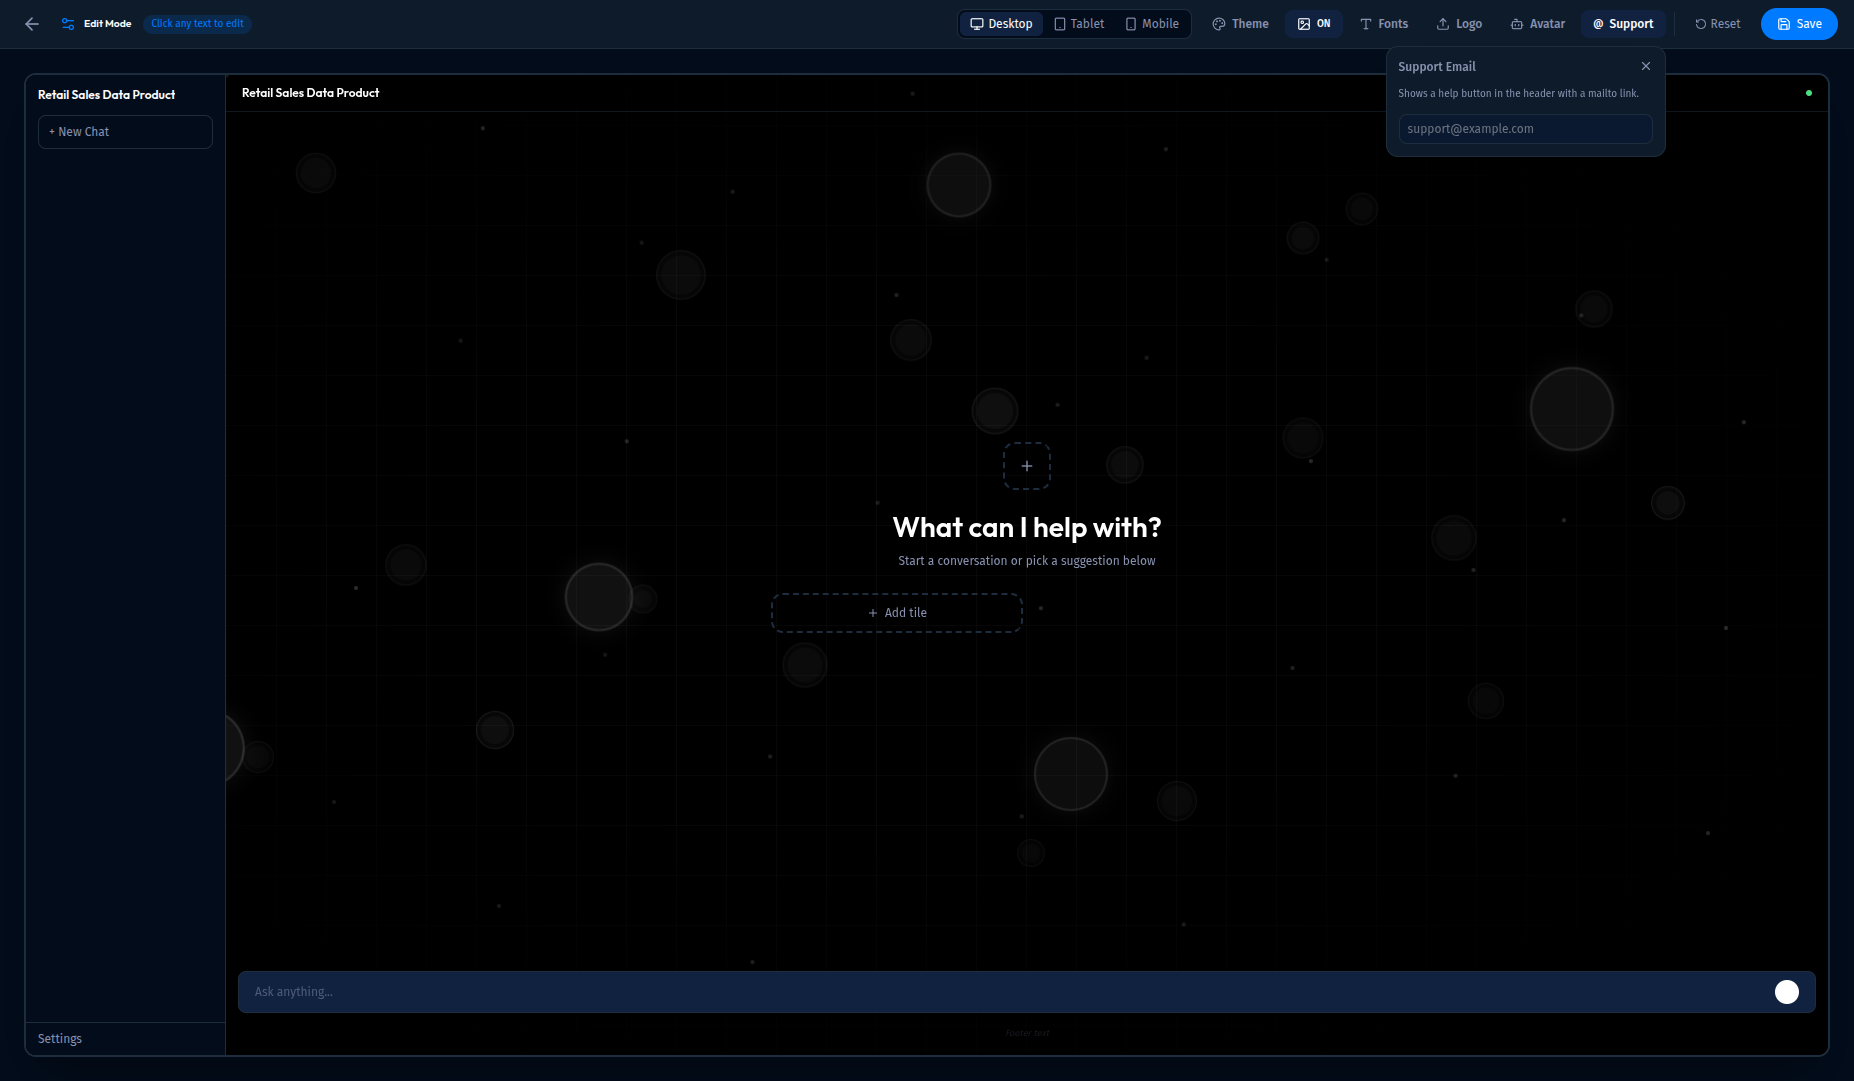
- Enter a Support Email address
- This adds a help button to the ChatApp header with a mailto link
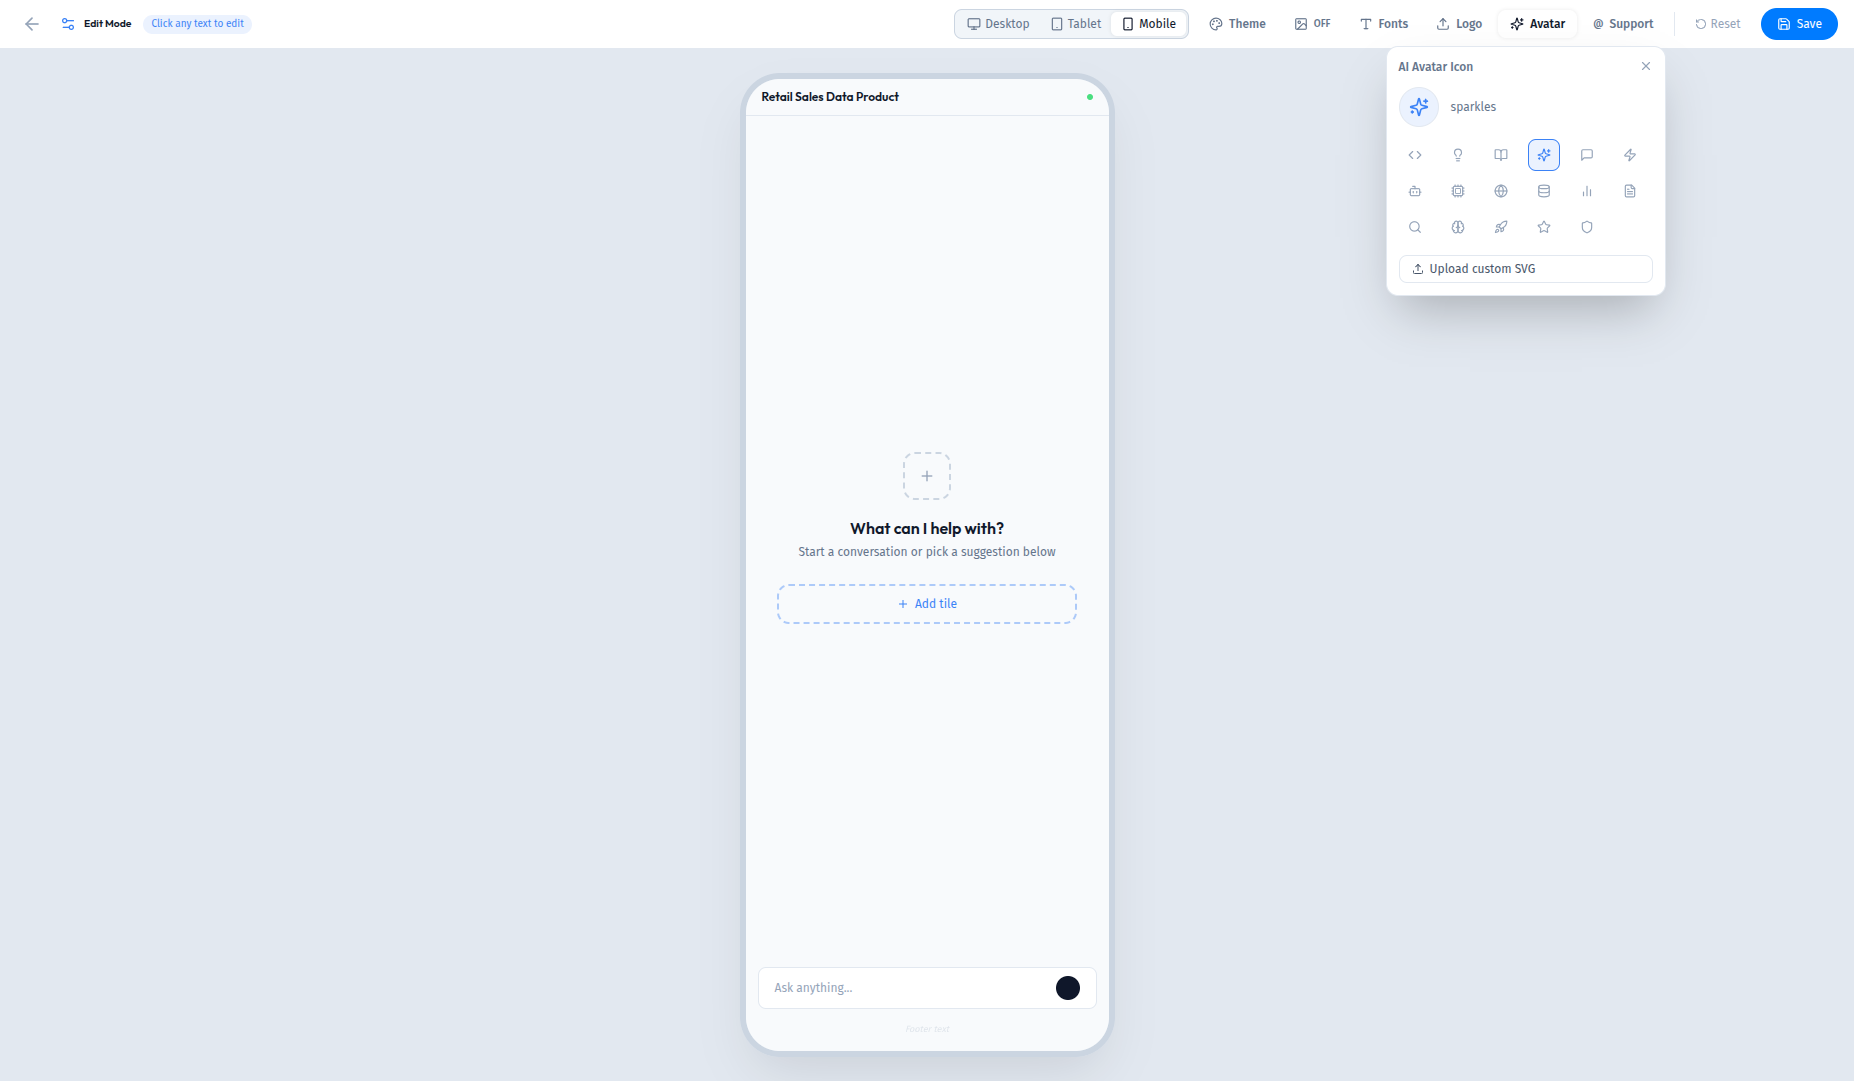
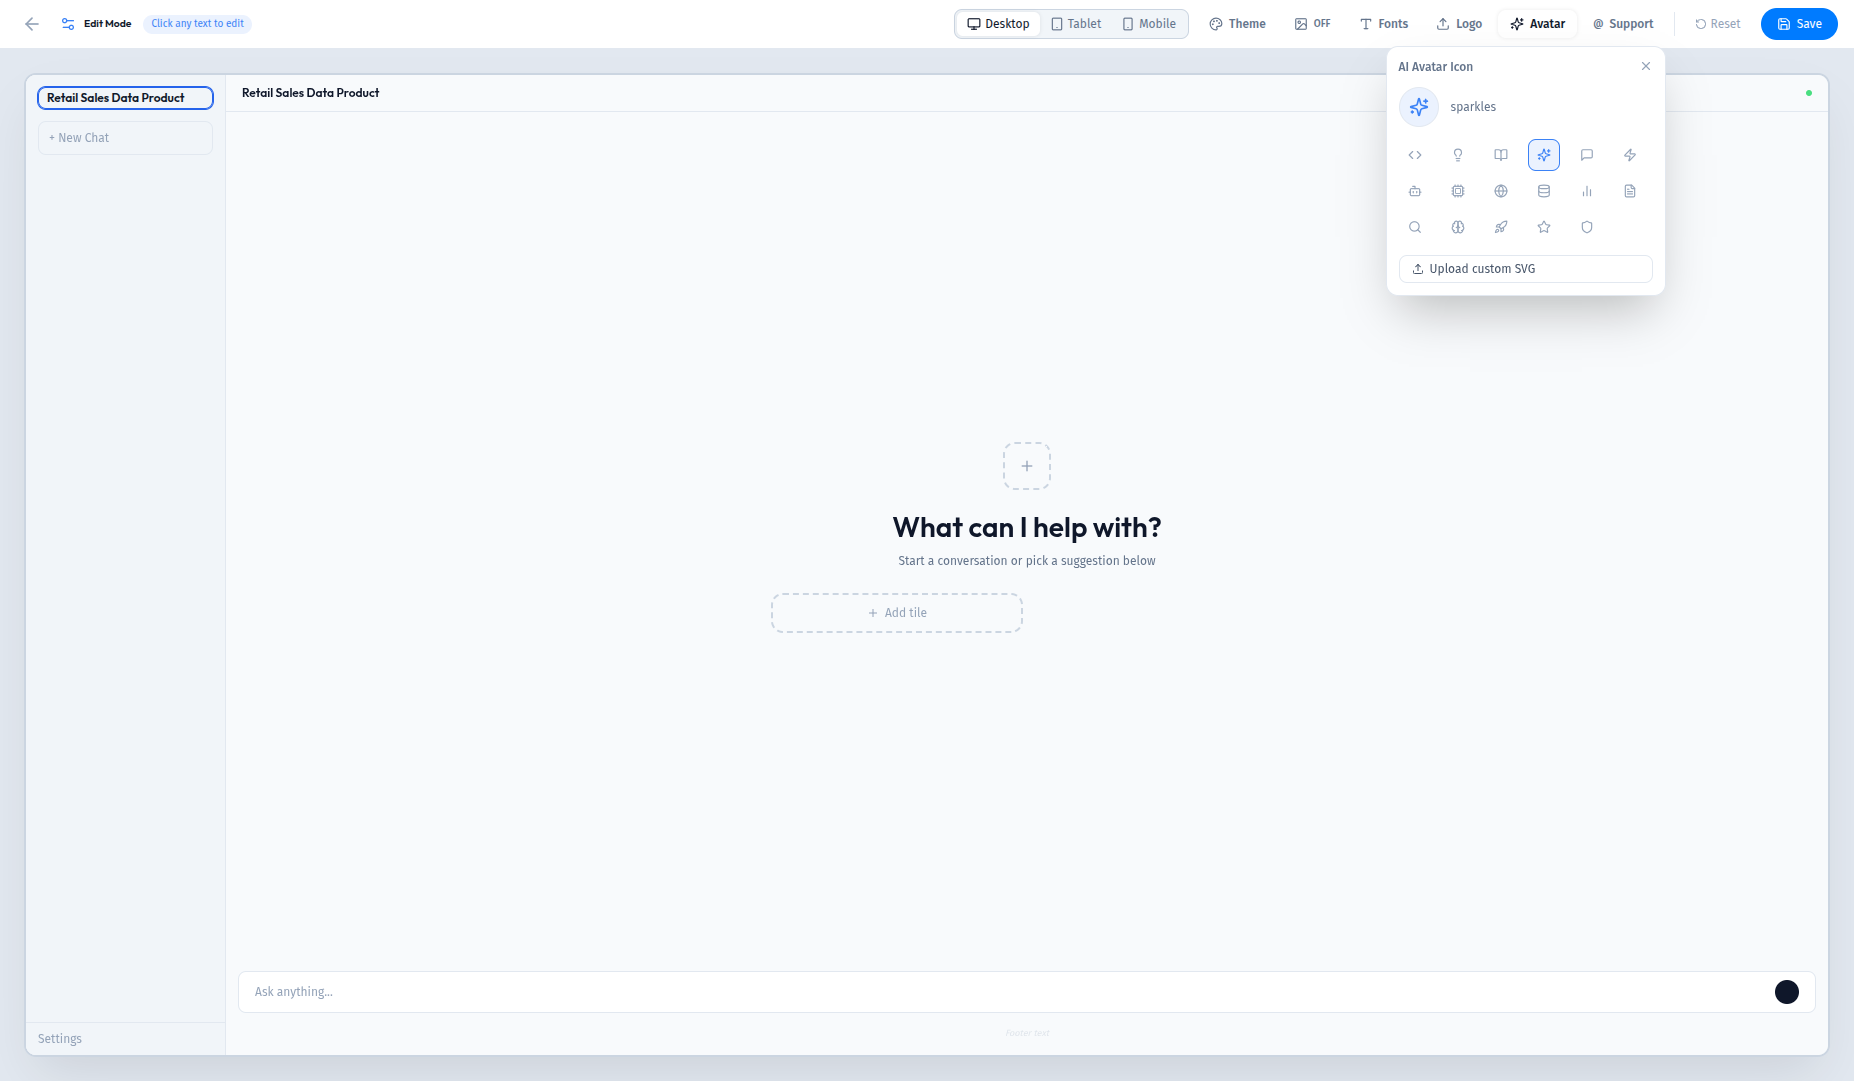
10.7 Preview Modes
Test how your ChatApp looks on different devices:
Tablet Preview:
Mobile Preview:
10.8 Editing Text
In Edit Mode, click on any text with a pencil icon to customize:
- App title in sidebar
- Main heading ("What can I help with?")
- Subtitle text
- Input placeholder
- Footer text
What's Next?
Now that you've completed the full workflow, explore these advanced features:
| Feature | Where to Find It | What It Does |
|---|---|---|
| Add Few-Shots | Prompt Flow → Few-Shots | Train the AI with example Q&A pairs |
| Manage Metadata | Prompt Flow → Metadata | Edit table and column descriptions |
| Configure Agents | Sidebar → Prompt Flow | Customize how AI agents process your queries |
| Add More Connections | Sidebar → Data Connections | Connect databases, APIs, and cloud storage |
Troubleshooting
Common Issues
| Issue | Solution |
|---|---|
| File upload fails | Check file size (under 100MB) and format (CSV, Parquet, JSON) |
| Workspace creation slow | Wait up to 60 seconds; refresh if stuck |
| No data showing | Ensure you selected datasets in Step 4 |
| AI gives wrong answers | Add Few-Shots to train the AI on your specific data |
| Can't edit prompts | Enable Admin toggle in top-right corner |
Need Help?
- Contact your workspace administrator
- Check the other pages in this documentation
- Review the Prompt Flow & Agents page for AI configuration
Summary
In this tutorial, you learned how to:
- Create a workspace — an isolated environment for your project
- Add a data connection — upload files or connect databases
- Configure datasets — select which tables to include
- Generate the Semantic Data Graph — automatically map your data
- Ask questions — query your data in plain English
- Create a Dashboard — pin charts to visual dashboards
- Create a Data Product — deploy structured data pipelines
- View Deployed Apps — access ChatApps, Data Products, and Dashboards
- Configure ChatApp Settings — customize themes, fonts, logos, and avatars
You're now ready to explore the full power of Intugle!