Page 2 — Data Connections
The Data Connections page is where you connect Intugle to your data sources. Once connected, your data becomes available to the AI for querying, building apps, and creating data products.

Page Layout
The page has two main sections:
- Your Connections — existing data sources already linked to this workspace
- Add New Connection — a grid of available data source types to connect
At the top, a 3-step wizard bar shows where you are in the connection setup process:
① Connections ────── ② Configuration ────── ③ Datasets
| Step | What Happens |
|---|---|
| 1. Connections | Choose the type of data source and provide credentials |
| 2. Configuration | Select tables and columns to import |
| 3. Datasets | Review the imported datasets before finishing |
Click Continue to Semantic Graph → (top right) once your connection is configured.
Note: If you see the banner "You don't have permission to manage connections. Contact Support", your user role does not have admin access. Contact your workspace administrator.
Your Connections
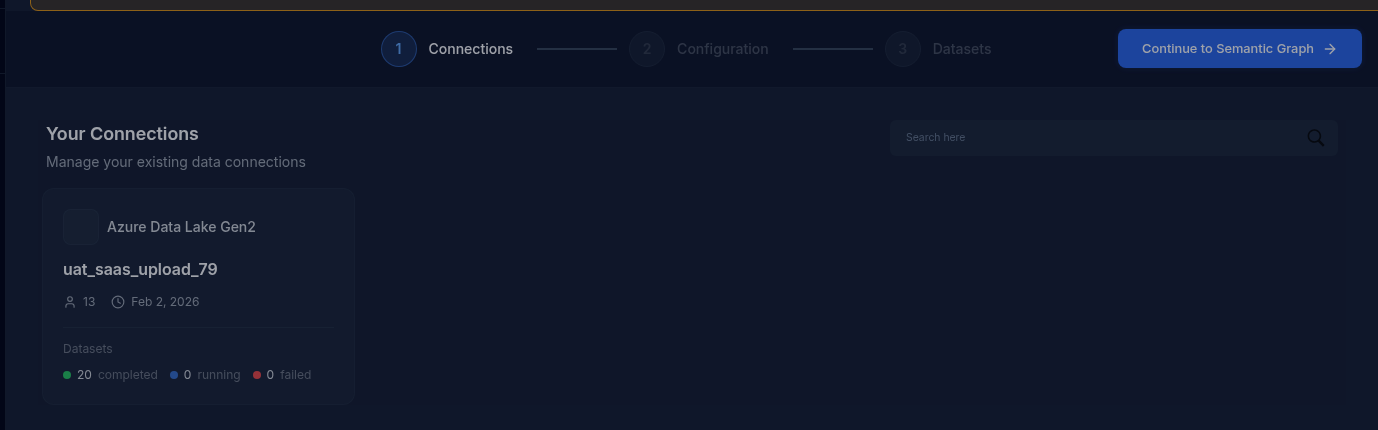
This section lists all data sources already connected to your workspace. Use the Search here box to filter connections by name.
Each connection card shows:
| Field | Description |
|---|---|
| Source type | The type of data source (e.g. Azure Data Lake Gen2) |
| Dataset name | The name of the connected dataset (e.g. uat_saas_upload_79) |
| Tables | Number of tables connected (e.g. 13) |
| Connected date | When the connection was created (e.g. Feb 2, 2026) |
| Datasets status | 🟢 completed · 🔵 running · 🔴 failed — count of datasets in each state |
In the example above, the workspace has one connection:
- Azure Data Lake Gen2 — dataset
uat_saas_upload_79, 13 tables, connected Feb 2 2026 - 20 completed datasets, 0 running, 0 failed
Add New Connection
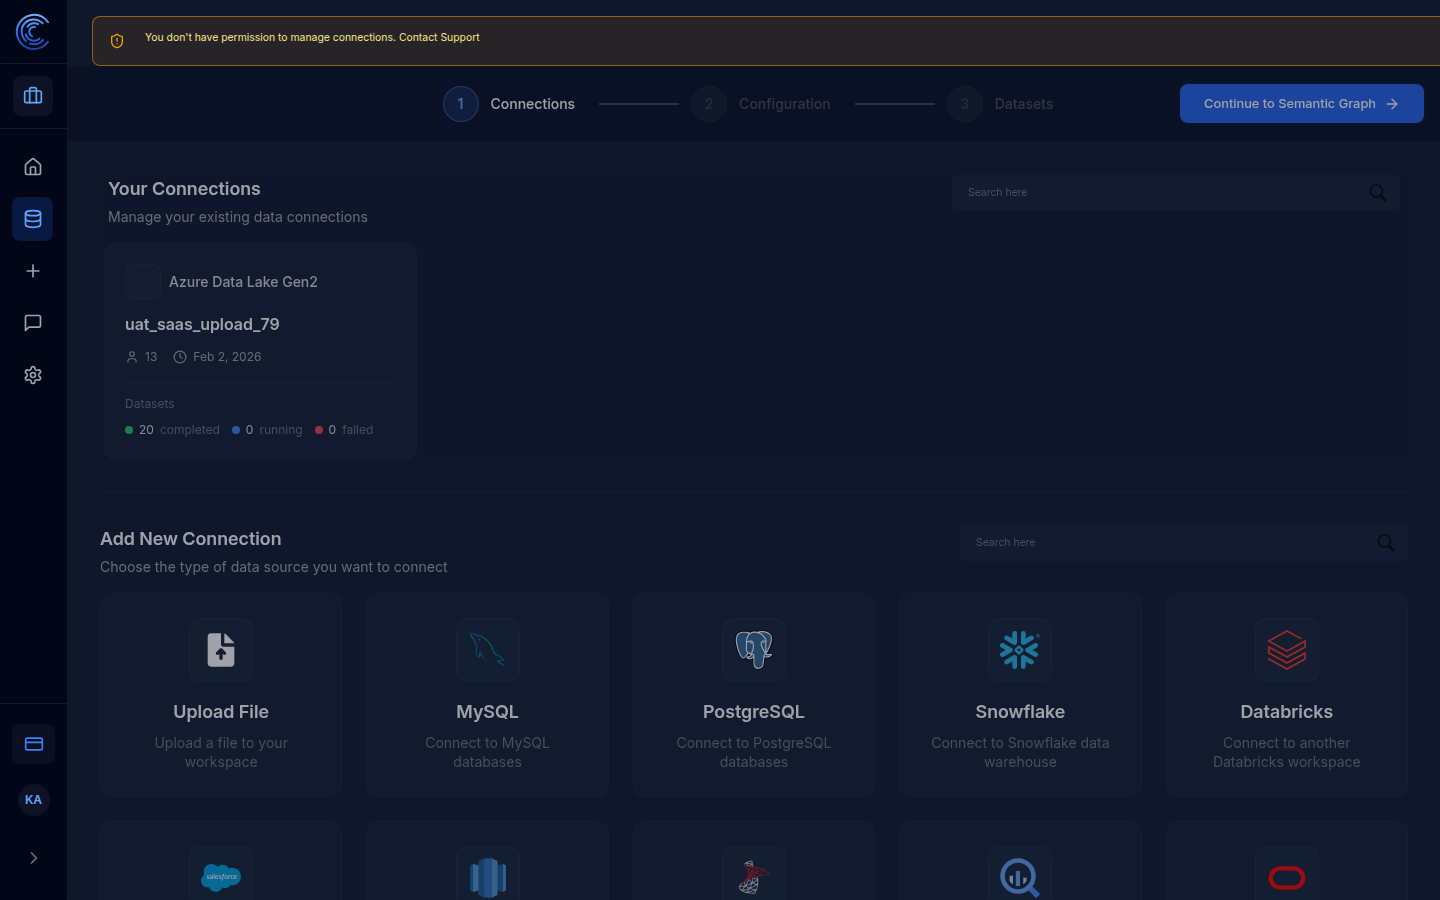
The lower section of the page lets you connect a new data source. Click any tile to begin the setup for that source type.
| Source | Description |
|---|---|
| Upload File | Upload a CSV, Excel, or other file directly to your workspace |
| MySQL | Connect to a MySQL relational database |
| PostgreSQL | Connect to a PostgreSQL relational database |
| Snowflake | Connect to a Snowflake cloud data warehouse |
| Databricks | Connect to a Databricks workspace |
| Salesforce | Connect to your Salesforce CRM |
| Azure Data Lake | Connect to Azure Data Lake Gen2 storage |
| (and more) | Scroll down to see all available connectors |
Use the Search here box (top right of the grid) to quickly find a specific connector type.
How to Add a New Connection
- Click the data source tile you want to connect (e.g. PostgreSQL)
- Enter the connection credentials — host, port, database name, username, password
- Click Test Connection to verify the credentials work
- Click Next to go to Configuration
- Select which tables and columns to include
- Click Next to go to Datasets
- Review the imported datasets and click Finish
Your new connection will appear under Your Connections and be available as a data source in the chat input on the Homepage.
Semantic Data Graph
When a data connection is set up and processed, you can build a Semantic Data Graph using the Agents Service page — a visual map of all your tables and their relationships.
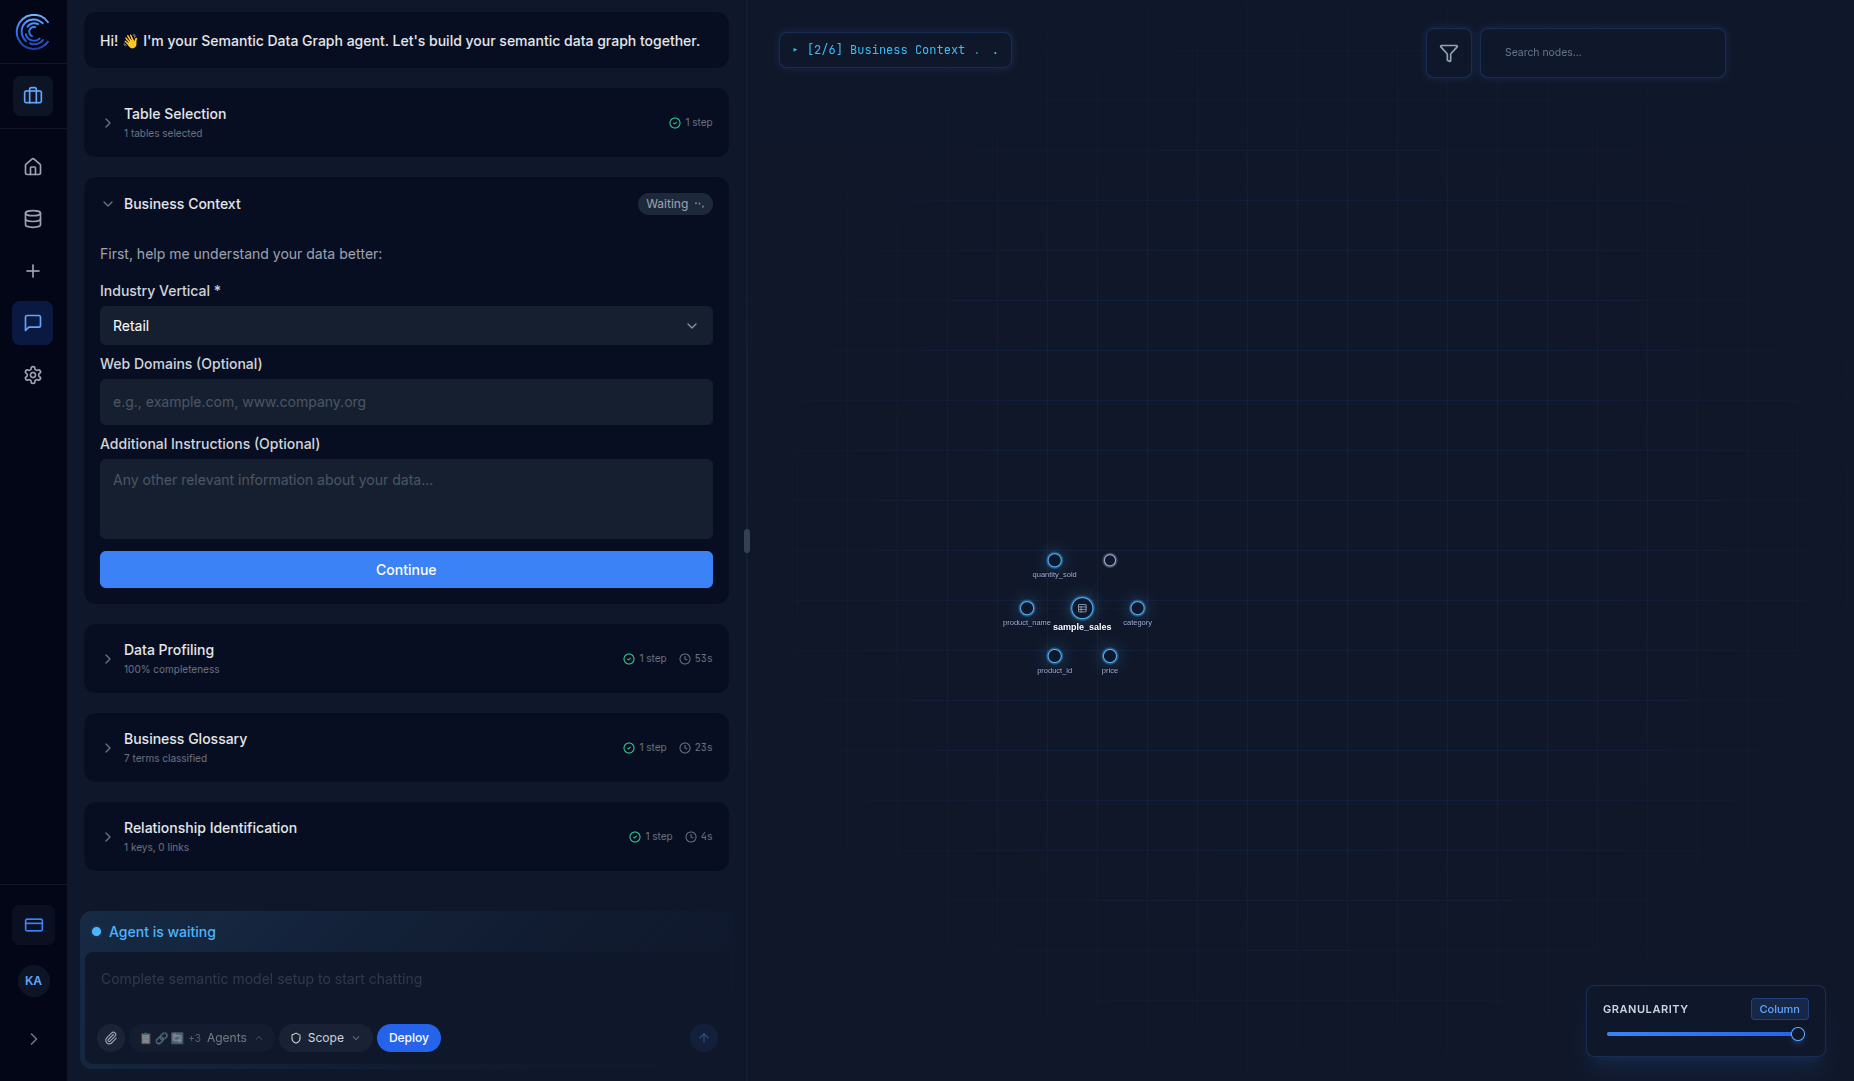
Graph Visualization Elements
| Element | Description |
|---|---|
| Center node | Your data table (highlighted in the center) |
| Connected nodes | Individual columns branching from the table |
| Node colors | Different colors indicate different data types or classifications |
| Lines between nodes | Represent relationships between tables or column connections |
| Granularity slider | Switch between Table and Column level views |
Pipeline Steps (shown during build)
The Semantic Data Graph agent walks you through these steps in a guided workflow:
| Step | What Happens | Example Result |
|---|---|---|
| Table Selection | Choose tables to include in the graph | 1 table selected |
| Business Context | Set your industry vertical (Retail, Healthcare, Finance, etc.) | Retail selected |
| Data Profiling | Analyze data quality and classify columns | 100% completeness, 5 Dimensions, 2 Measures |
| Business Glossary | Generate business term definitions | 7 terms classified |
| Relationship Identification | Find primary/foreign key relationships | 1 key, 0 links (single table) |
Data Profiling Details
The Data Profiling step provides comprehensive analysis of your data:
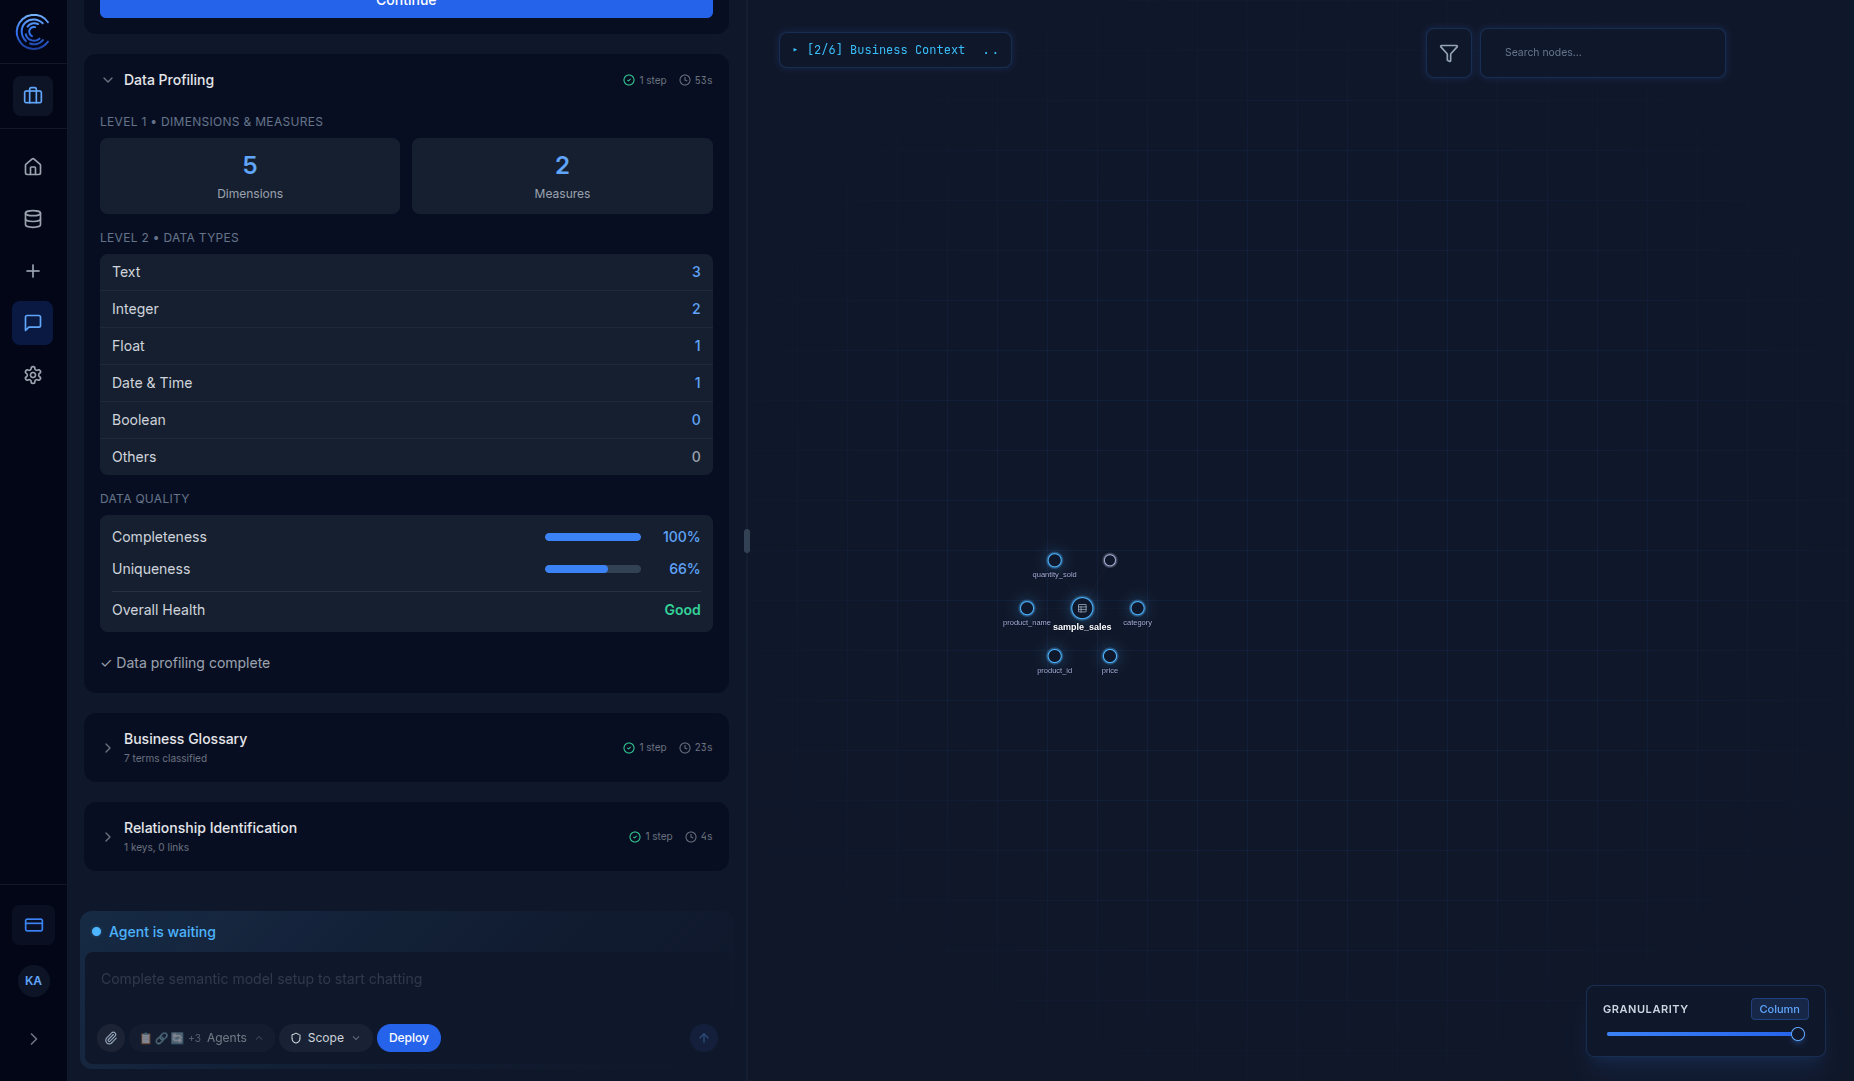
| Metric | Description |
|---|---|
| Dimensions & Measures | Classifies columns as categorical (dimensions) or numeric (measures) |
| Data Types | Breakdown by type: Text, Integer, Float, Date & Time, Boolean, Others |
| Completeness | Percentage of non-null values across your data |
| Uniqueness | Percentage of unique values (helps identify potential keys) |
| Overall Health | Summary assessment: Good, Fair, or Poor |
Once complete: "Semantic Data Graph Generated! You can now start exploring and analyzing your data."
A chat input at the bottom lets you query the data directly from this view, with a Deploy button to publish what you build into an app.